
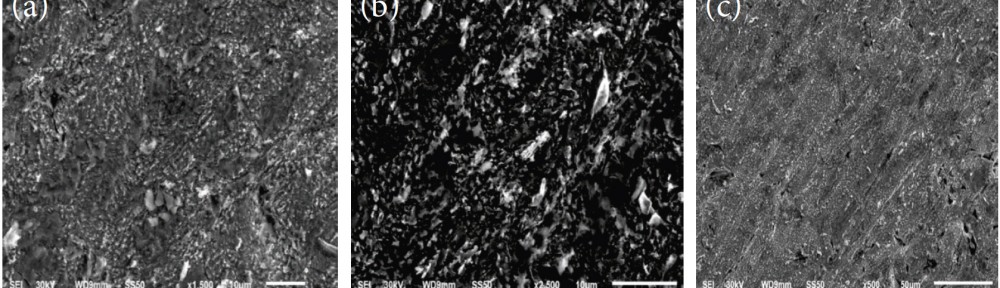
 Fig. 9a-c: SEM micrographs of copper surface (a) before of immersion in 1 M HNO3, (b) after 48 h of immersion in 1 M HNO3, (c) after 48 h of immersion in 1 M HNO3+ 11x10-6 M of Rosmarinus extract at 25°C
The efficiency of plant extract as corrosion extract for copper in 1M HNO3 medium was carried out using weight loss, potentiodynamic polarization, electrochemical impedance spectroscopy (EIS) and electrochemical frequency modulation (EFM) techniques. The results showed variation in inhibition performance of the extract with varying concentration, immersion time and temperature. Langmuir isotherm was tested to describe the adsorption behavior of the extract on the copper surface. Potentiodynamic polarization study clearly revealed that this extract acts as a mixed type inhibitor i.e. the addition of the extract enhances both cathodic and anodic reactions. The results of the electrochemical impedance study showed a decrease in double layer capacitance and an increase in the charge transfer resistance. The results showed that rosmarinus extract could play significant role as corrosion inhibitor for copper in 1M HMO3.
1. Introduction
In industries, hydrochloric acid and nitric acid is widely used for acid pickling, acid cleaning and removing rust and decaling acids [1]. Therefore, the corrosion process controls under the influence of acidic conditions are important subjects worthy of intensive research. Most organic substance and plant extracts employed as corrosion inhibitors for copper protect the metal from corrosion by forming a chelate on the metal surfaces [2]. The efficiency of the extract depends on the stability of the chelate formed [3]. The variation in inhibitive efficiency mainly depends on the type and the nature of the substituents present in the extract molecule [4]. Due to environmental requirements currently imposed environmental corrosion extracts, there is a growing interest in the use of natural products (green corrosion inhibitors) such as extracts of leaves, seeds or bark extracts. These green corrosion inhibitors are biodegradable and do not contain heavy metals or other toxic compounds. Some research groups have reported the successful use of naturally occurring substances to inhibit the corrosion of metals in acidic and alkaline environment. Delonix regia extracts inhibited the corrosion of Al in HCl solutions [5], rosemary leaves were studied as corrosion inhibitor for the Al + 2.5 Mg alloy in a 3% NaCl solution at 25°C [6], and El-Etre investigated natural honey as a corrosion inhibitor for Cu [7] and investigated opuntia extract on Al [8]. The inhibitive effect of the extract of khillah seeds on the corrosion of SX 316 steel in HCl solution was determined. The mechanism of action is attributed to the formation of insoluble complexes as a result of interaction between iron cations, and khillah [9]. Ebenso et al. showed the inhibition of corrosion with ethanolic extract of African bush pepper (Piper guinensis) on mild steel [10];Carica papaya leaves extract [11]; neem leaves extract (Azadirachta indica) on mild steel in H2SO4 [12]. Zucchi and Omar investigated plant extracts of Papaia, Poinciana pulcherrima, Cassia occidentalis, and Datura stramonium seeds and Papaya, Calotropis procera B, Azadirachta indica, and Auforpio turkiale sap for their corrosion inhibition potential and found that all extracts except those of Auforpio turkiale and Azadirachta indica reduced the corrosion of steel with an efficiency of 88%–96% in 1 N HCl and with a slightly lower efficiency in 2 N HCl. They attributed the effect to the products of the hydrolysis of the protein content of these plants [13]; Umoren et al. [14] studied the corrosion inhibition of mild steel in H2SO4 in the presence of gum arabic (GA) (naturally occurring polymer) and polyethylene glycol (PEG) (synthetic polymer). It was found that PEG was more effective than gum arabic. Fouda et al. investigated the effect of Melilotus officinalis Extract (MOE), as a green corrosion inhibitor for Al in 1 M HCl [15], Adhatoda aqueous plant extract as Corrosion inhibitor for carbon steel in sanitation water in polluted NaCl solutions [16], Roselle extract [17] and Thevetia peruviana as corrosion inhibitors for carbon steel in HCl solution [18]. Some other authors reported the use of natural products in the development of green corrosion extracts as effective for different metals in various environments [18- 24].
The aim of this work is to study the corrosion inhibition of copper in 1 M HNO3 using rosmarinus extract as green corrosion inhibitor by chemical and electrochemical measurements.
2. Experimental Method
2.1 Materials and solutions

Tab. 1: Chemical composition of used copper in weight %
Table 1 shows the chemical composition of the tested copper in chemical and electrochemical methods.
The experimental measurements were carried out in 1 M HNO3 solution in the absence and presence of various concentrations of rosmarinus extract.
2.2 Methods used for corrosion measurements
2.2.1 Weight loss measurements
For weight loss measurements, square specimens of size 2 x 2 x 0.2 cm were used. The specimens were first abraded to a mirror finish using different grades (320 –1200 grade) of emery papers, degreased with acetone, washed with bidistilled water and dried with soft paper before weighed. The weight loss measurements were carried out in a 100 ml capacity glass beaker placed in water thermostated bath. The specimens were then immediately immersed in the test solution without or with desired concentration of the investigated plant extract. Triplicate specimens were exposed for each condition and the mean weight losses were reported in order to verify reproducibility of the experiments. The inhibition efficiency (IE) and the degree of surface coverage (θ) of the investigated extract on corrosion of copper were calculated using equation (1) [25]:
Equation 1: %IE = θ x 100 = [1-(W/Wo)] x100
Where W and Wº are the weight losses in the presence and absence of the extract, respectively.
2.2.2. Electrochemical Measurements
Polarization experiments were carried out in a conventional three-electrode cell with a platinum counter electrode (1 cm2) and a saturated calomel electrode (SCE) coupled to a fine Luggin capillary (to minimize the IR resistance) as the reference electrode. The working electrode was in the form of a square cut from copper embedded in epoxy resin of polytetrafluoroethylene (PTFE) so that the flat surface was the only surface in the electrode. The working electrode was immersed in the test solution before starting the measurements, until a steady state was reached (30 min). For potentiodynamic polarization measurements, the potential was scanned at a scan rate of 1mVs−1. Potential changed automatically from -0.600 to 1 V vs SCE. EIS measurements were performed at open circuit potential over a frequency range of 0.1 Hz to 100 kHz. The sinusoidal potential perturbation was 5 mV in amplitude. EFM carried out using two frequencies 2.0 and 5.0 Hz. The base frequency was 1.0 Hz. We use a perturbation signal with amplitude of 10 mV for both perturbation frequencies of 2.0 and 5.0 Hz.
The electrochemical measurements were carried out using a Gamry instrument Potentiostat/Galvanostat/ZRA (PCI300/4). This includes a Gamry Framework system based on the ESA400, Gamry applications that include DC105 for dc corrosion measurements, EIS300 software for electrochemical impedance spectroscopy and EFM140 software for electrochemical frequency modulation measurements along with a computer for collecting data. Electrochemical data were analyzed by Echem Analyst 5.5 software.
2.2.3 Scanning electron microscopy measurements (SEM)
The electron surface of copper was examined by scanning electron microscope- type JOEL 840, Japan before and after immersion in 1 M HNO3 test solution in the absence and presence of the optimum concentration of the investigated extract at 25oC, for 2 days immersion time. The specimens were washed gently with bidistilled water, then dried carefully and examined without any further treatments.
3. Results and Discussion
3.1. Chemical method (Weight loss method)
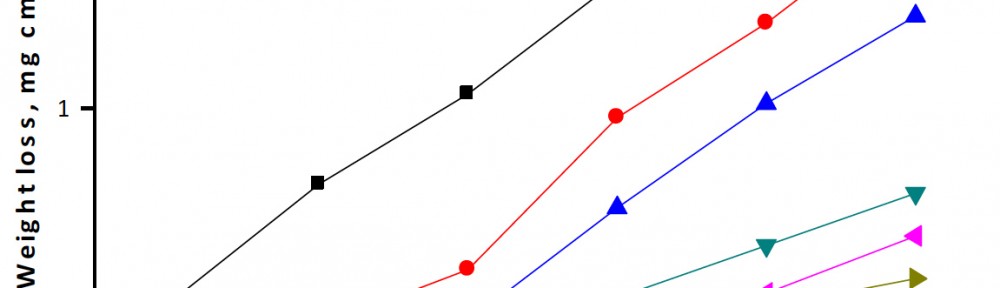
Weight-loss of copper was determined, at various time intervals, in the absence and presence of different concentrations of the extract. The obtained weight loss-time curves are represented in Figure 1 for rosmarinus extract. The inhibition efficiency of corrosion was found to be dependent on the extract concentration (Table 2). The curves obtained in the presence of extract fall significantly below that of free acid. In all cases, the increase in the extract concentration was accompanied by a decrease in weight-loss and an increase in the percentage inhibition. These results lead to the conclusion that rosmarinus extract under investigation is fairly efficient as extract for copper dissolution in nitric acid solution. Also, the degree of surface coverage (Ө) by the extract was found to increase with increasing the extract concentration.

Fig. 1: Weight loss-time curves for the corrosion of copper in 1 M HNO3 in the absence and presence of different concentrations of rosmarinus extract at 25ᵒC

Tab. 2: Values of inhibition efficiencies (% IE) and surface coverage
(θ) of extract for the corrosion of copper in 1 M HNO3 from weight loss measurements at different concentrations and at 25oC
3.2. Effect of Temperature
The effect of temperature on the corrosion rate of copper in 1M HNO3 and in presence of different extract concentrations was studied in the temperature range of 298–313K using weight loss measurements. As the temperature increases, the rate of corrosion decreases and the inhibition efficiency of the extract increases as shown in Table 3 for rosmarinus extract. The adsorption behavior of extract on copper surface occurs through chemical adsorption.

Table 3: Values of inhibition efficiencies %IE and corrosion rate (C.R) of rosmarinus extract for the corrosion of copper in 1 M HNO3 from weight-loss measurements at different concentrations at temperature range of 298-313 K.
3.3. Adsorption isotherms
One of the most convenient ways of expressing adsorption quantitatively is by deriving the adsorption isotherm that characterizes the metal/extract/ environment system. Various adsorption isotherms were applied to fit θ values, but the best fit was found to obey Langmuir adsorption isotherm which are represented in Figure 2 for Rosmarinus extract, Langmuir adsorption isotherm may be expressed by eq. (2):
Equation 2: C/ ϴ=1/Kads+ C
Where C is the concentration (ml\L) of the extract in the bulk electrolyte, Kads is the adsorption equilibrium constant. A plot of ϴ versus C/θ should give straight lines. In order to get a comparative view, the variation of the adsorption equilibrium constant (Kads) of the extract with its molar concentration was calculated. The experimental data give good curve fitting for the applied adsorption isotherm as the correlation coefficients (R2) were close to unity. The extent of inhibition is directly related to the performance of adsorption layer which is sensitive function of a molecular structure. The equilibrium constant of adsorption Kads obtained from the intercepts of Langmuir adsorption isotherm is related to the free energy of adsorption ΔG°ads as follows:
Equation 3: Kads =1/ 55.5 exp (-ΔGºads/ RT)
where, the value 55.5 is the concentration of water on the metal surface in mol/L. Plot of (ΔGºads) versus T (Fig. 3) gave the heat of adsorption (ΔHᵒads) and the entropy (ΔSᵒads) according to the thermodynamic basic eq. (4):
Equation 4: ΔGºads=ΔHᵒads-TΔSᵒads
Table 4 clearly shows a good dependence of ΔGºads on T, indicating the good correlation among thermodynamic parameters. The negative value of of ΔGºads reflects that the adsorption of studied extract on copper surface from 1 M HNO3 solution is spontaneous process and stability of the adsorbed layer on copper surface. Generally, values of ΔGºads around -20 kJ mol-1 or lower are consistent with the electrostatic interaction between the charged molecules and the charged metal (physical adsorption); those around -40 kJ mol-1 or higher involves formation of coordinate bond (chemisorption) [26]. The calculated ΔGoads values are in between -20 and -40 kJ mol-1 indicating that the adsorption mechanism of the extract on copper in 1 M HNO3 solutions was typical comprehensive of physical and chemical adsorption.

Fig. 2: Langmuir adsorption isotherm plotted as C/θ vs C of Rosmarinus extract for corrosion of copper in 1M HNO3 solution from weight loss method at 25ºC

Tab. 4: Adsorption parameters for Rosmarinus extract in 1 M HNO3 obtained from Langmuir adsorption isotherm at different temperatures
Plot of (ΔGoads) versus T Figure 3 gave the heat of adsorption (ΔHoads) and the standard entropy (ΔSoads) according to the thermodynamic basic eq. (5):
Equation 5: ΔGoads = ΔHoads– T ΔSoads
The values of thermodynamic parameter for the adsorption of extract Table 4 can provide valuable information about the mechanism of corrosion inhibition. While an endothermic adsorption process (ΔHoads > 0) is attributed unequivocally to an exothermic adsorption process (ΔHoads < 0) may involve either exothermic adsorption or endothermic adsorption or mixture of both processes. In the presented case, the calculated positive values of ΔHoads for the adsorption of extract in 1 M HNO3 indicating that Rosmarinus extract may be chemically adsorbed. The ΔSoads values in the presence of extract in 1 M HNO3 are positive. . This indicates that an increase in disorder takes places on going from reactants to the metal-adsorbed reaction complex [27].

Fig. 3: Variation of ΔGoads versus T for the adsorption of extract on copper surface in 1 M HNO3 at different temperatures
3.4. Kinetic –thermodynamic corrosion parameters
The activation parameters for the corrosion process were calculated from Arrhenius-type plot according to eq. (6):
Equation 6: kcorr = A exp (E*a/RT)
Where E*a is the apparent activation corrosion energy, R is the universal gas constant, T is the absolute temperature and A is the Arrhenius pre-exponential constant. Values of apparent activation energy of corrosion for copper in 1 M HNO3 shown in Table 5, without and with various concentrations of Rosmarinus extract determined from the slope of log (kcorr) versus 1/T plots are shown in Figure 4. Inspection of the data shows that the activation energy is lower in the presence of extract than in its absence. This was attributed to slow rate of extract adsorption with a resultant closer approach to equilibrium during the experiments at higher temperatures according to Hoar and Holliday [28]. But, Riggs and Hurd [29] explained that the decrease in the activation energy of corrosion at higher levels of inhibition arises from a shift of the net corrosion reaction from the uncovered part of the metal surface to the covered one. Schmid and Huang [30] found that organic molecules inhibit both the anodic and cathodic partial reactions on the electrode surface and a parallel reaction takes place on the covered area, but the reaction rate on the covered area is substantially less than on the uncovered area similar to the present study. The alternative formulation of transition state equation is shown in eq. (7):
Equation 7: kcorr = (RT/Nh) exp (ΔS*/R)exp (-ΔH*/RT)
Where kcorr is the rate of metal dissolution, h is Planck’s constant, N is Avogadro’s number, ΔS* is the entropy of activation and ΔH* is the enthalpy of activation. Figure 5 shows a plot of log k/T against (1/T) in 1 M HNO3. Straight lines are obtained with slopes equal to (ΔH* /2.303R) and intercepts are [log (R/Nh + ΔS*/2.303R)] are calculated and their values are listed in Table 5.
The increase in Ea* with increase extract concentration Table 5 is typical of physical adsorption. The positive signs of the enthalpies (ΔH*) reflect the endothermic nature of the copper dissolution process. Value of entropies (ΔS*) imply that the activated complex at the rate determining step represents an association rather than a dissociation step, meaning that a decrease in disordering takes place on going from reactants to the activated complex [31,32].

Fig. 4: Arrhenius plots for copper corrosion rates (kcorr) after 120 minute of immersion in 1 M HNO3 in the absence and presence of various concentrations of rosmarinus extract

Fig. 5: Transition-state for copper corrosion rates (kcorr/T) in 1 M HNO3 in the absence and presence of various concentrations of Rosmarinus extract

Tab. 5: Activation parameters for copper corrosion in the
absence and presence of various concentrations of Rosmarinus
extract in 1 M HNO3
3.5. Potentiodynamic polarization measurements
Figures 6 shows typical polarization curves for copper in 1 M HNO3 solution. The two distinct regions that appeared were the active dissolution region (apparent Tafel region), and the limiting current region. In the extract-free solution, the anodic polarization curve of copper showed a monotonic increase of current with potential until the current reached the maximum value. After this maximum current density value, the current density declined rapidly with potential increase, forming an anodic current peak that was related to Cu (NO3)2 film formation. In the presence of extract, both the cathodic and anodic current densities were greatly decreased over a wide potential range. Various corrosion parameters such as corrosion potential (Ecorr.), anodic and cathodic Tafel slopes (βa, βc), the corrosion current density (icorr), the degree of surface coverage (θ) and the inhibition efficiency (%IE) are given in Table 6. It can see from the experimental results that in all cases, addition of extract induced a significant decrease in cathode and anodic currents. The values of Ecorr were affected and slightly changed by the addition of extract. This indicates that chenopodium extract acts as mixed-type extract. The slopes of anodic and cathodic Tafel lines (βa and βc), were slightly changed (Tafel lines are parallel), on increasing the concentration of chenopodium extract which indicates that there is no change of the mechanism of inhibition in the presence and absence of extract. The orders of inhibition efficiency of extract at different concentrations as given by polarization measurements are listed in Table 6. The results are in good agreement with those obtained from weight-loss measurements. The inhibition efficiencies %IEEFM increase by increasing the inhibitor concentrations and was calculated as from Eq. (8):
Equation 8: %IEEFM = [1-(icorr/iocorr)] ×100
Where iocorr and icorr are corrosion current densities in the absence and presence of Rosmarinus extract.

Fig. 6: Potentiodynamic polarization curves for the dissolution of copper in 1M HNO3 in absence and presence of different concentrations of Rosmarinus extract at 25oC

Tab. 6: Corrosion potential (Ecorr), corrosion current density (icorr), Tafel slopes (βa , βc) ,degree of surface coverage(θ) and inhibition efficiency (% IE) of copper in 1M HNO3 at 25oC for Rosmarinus extract
3.6. Electrochemical impedance spectroscopy (EIS) measurements
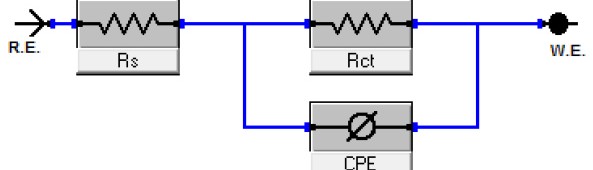
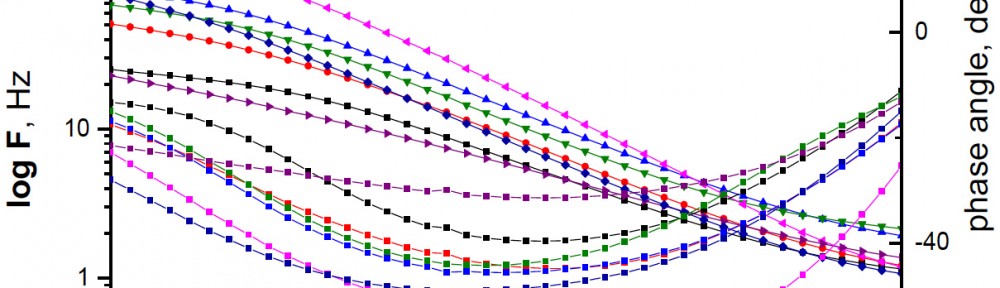
EIS is well-established and it is powerful technique for studying the corrosion. Surface properties, electrode kinetics and mechanistic information can be obtained from impedance diagrams [33-37]. Figure 7 shows the Nyquist (a) and Bode (b) plots obtained at open-circuit potential both in the absence and presence of increasing concentration of Rosmarinus extract at 25°C. The increase in the size of the capacitive loop with the addition of extract shows that a barrier gradually forms on the copper surface. The increase in the capacitive loop size (Figure 7a) enhances, at a fixed extract concentration, following the order. Bode plots (Figure 7b), shows that the total impedance increases with increasing extract concentration (log Z vs. log f). But (log f vs. phase), also Bode plot shows the continuous increase in the phase angle shift, obviously correlating with the increase of extract adsorbed on copper surface. The Nyquist plots do not yield perfect semicircles as expected from the theory of EIS. The deviation from ideal semicircle was generally attributed to the frequency dispersion [38] as well as to the inhomogenities of the surface. EIS spectra of the investigated extract were analyzed using the equivalent circuit, Figure 8, which represents a single charge transfer reaction and fits well with our experimental results. The constant phase element, CPE, is introduced in the circuit instead of a pure double layer capacitor to give a more accurate fit [39]. The double layer capacitance, Cdl, for a circuit including a CPE parameter (Y0 and n) was calculated from eq.9 [40]:
Equation 9: Cdl = Y0 (ωmax) n-1
whereY0 is the magnitude of the CPE, ωmax = 2πfmax, fmax is the frequency at which the imaginary component of the impedance is maximal and the factor n is an adjustable parameter that usually lies between 0.50 and 1.0. After analyzing the shape of the Nyquist plots, it is concluded that the curves approximated by a single capacitive semicircles, showing that the corrosion process was mainly charged-transfer controlled [41, 42] .The general shape of the curves is very similar for all samples (in presence or absence of extract at different immersion times) indicating that no change in the corrosion mechanism [43]. From the impedance data Table 7, we concluded that the value of Rct increases with increasing the concentration of the extract and this indicates an increase thickness of the barrier layer formed on copper surface. In fact the presence of extracts enhances the value of Rct in acidic solution. Values of double layer capacitance are also brought down to the maximum extent in the presence of extract and the decrease in the values of CPE follows the order similar to that obtained for icorr in this study. The decrease in CPE/Cdl results from a decrease in local dielectric constant and/or an increase in the thickness of the double layer, suggesting that organic derivatives inhibit the copper corrosion by adsorption at metal/acid [44, 45] .The inhibition efficiency was calculated from the charge transfer resistance data from eq.10 [46]:
Equation 10: % IEEIS = [1 –(R°ct/ Rct)] ×100
where Roct and Rct are the charge-transfer resistance values without and with extract, respectively.

Fig. 7a: The Nyquist plots for corrosion of copper in 1M HNO3 in the absence and presence of different concentrations of Rosmarinus extract at 25OC

Fig. 7b: The Bode plots for the corrosion of copper in 1M HNO3 in the absence and presence of different concentrations of Rosmarinus extract at 25OC

Fig. 8: Equivalent circuit model used to fit experimental EIS

Tab. 7: Electrochemical kinetic parameters obtained by EIS technique for in 1 M HNO3 without and with various concentrations of Rosmarinus extract at 25oC
3.7. Electrochemical frequency modulation (EFM) measurements
EFM is a nondestructive corrosion measurement technique that can directly and quickly determine the corrosion current values without prior knowledge of Tafel slopes, and with only a small polarizing signal. These advantages of EFM technique make it an ideal candidate for online corrosion monitoring [45]. The great strength of the EFM is the causality factors which serve as an internal check on the validity of EFM measurement. The causality factors CF-2 and CF-3 are calculated from the frequency spectrum of the current responses. The experimental EFM data were treated using two different models: complete diffusion control of the cathodic reaction and the “activation” model. For the latter, a set of three non-linear equations had been solved, assuming that the corrosion potential does not change due to the polarization of the working electrode [46]. The larger peaks were used to calculate the corrosion current density (icorr), the Tafel slopes (βc and βa) and the causality factors (CF-2 and CF-3).These electrochemical parameters were listed in Table 8. The data presented in Table 8 obviously show that, the addition of Rosmarinus extract at a given concentration to the acidic solution decreases the corrosion current density, indicating that this compound inhibits the corrosion of copper in 1 M HNO3 through adsorption. The causality factors obtained under different experimental conditions are approximately equal to the theoretical values (2 and 3) indicating that the measured data are verified and of good quality. The inhibition efficiencies %IEEFM increase by increasing the extract concentrations and was calculated as from eq. (8)

Tab. 8: Electrochemical kinetic parameters obtained by EFM technique for copper in the absence and presence of various concentrations of chenopodium extract in 1M HNO3 at 25oC
3.8. Surface examination
In order to verify if the Rosmarinus extract molecules are in fact adsorbed on copper surface, SEM experiments were carried out. The SEM micrographs for copper surface alone and after 48 h immersion in 1 M HNO3 without and with the addition of 11×10-6 M of Rosmarinus extract are shown in Figures (9a-c). As expected, Figure9a shows metallic surface is clear, while in the absence of extract, the copper surface is damaged by HNO3 corrosion (Figure9b). In contrast, in presence of the investigated extract (Figures (9c)); the metallic surface seems to be almost no affected by corrosion. The formation of a thin film of chenopodium extract observed in SEM micrograph, thus protecting the surface against corrosion

Fig. 9a-c: SEM micrographs of copper surface (a) before of immersion in 1 M HNO3, (b) after 48 h of immersion in 1 M HNO3, (c) after 48 h of immersion in 1 M HNO3+ 11×10-6 M of Rosmarinus extract at 25°C
3.9. Mechanism of corrosion inhibition
Results of the present study have shown that Rosmarinus extract inhibits the acid induced corrosion of copper by virtue of adsorption of its components (major components [47] were α-pinene (40.55 to 45.10%), 1,8-cineole (17.40 to 19.35%), camphene (4.73 to 6.06%) and verbenone (2.32 to 3.86%) onto the metal surface. The inhibition process is a function of the metal, extract concentration, and temperature as well as inhibitor adsorption abilities which is so much dependent on the number of adsorption sites. The mode of adsorption (physisorption and chemisorption) observed could be attributed to the fact that Rosmarinus contains many different chemical compounds which some can adsorbed chemically and others adsorbed physically. This observation may be attributed to the fact that adsorbed organic molecules can influence the behavior of electrochemical reactions involved in corrosion processes in several ways. The action of organic inhibitors depends on the type of interactions between the substance and the metallic surface. The interactions can bring about a change either in electrochemical mechanism or in the surface available for the processes [48].
4. Conclusions
From the results of the study the following may be concluded:
- Rosmarinus extract is good corrosion extract for copper in 1 M HNO3 solution.
- Reasonably good agreement was observed between the values obtained from the weight loss and electrochemical measurements.
- Results obtained from potentiodynamic polarization indicated that Rosmarinus extract is mixed-type inhibitor
- Percentage inhibition efficiency of Rosmarinus extract was temperature dependent and its addition led to a decrease of the activation corrosion energy.
- The thermodynamic parameters revealed that the inhibition of corrosion by Rosmarinus extract is due to the formation of a chemical adsorbed film on the metal surface.
- The adsorption of Rosmarinus extract onto copper surface follows the Langmuir adsorption isotherm model.
References
- M.Scendo, Corros. Sci., 49 (2007) 3953.
- M.Duprat, N.Bui, F.Dabost, Corrosion 35 (1979) 392.
- J.M.Costa, Lluch J.M., Corrosion Science 24 (1984) 929.
- B.Dus, Z.S.Smialowska, Corrosion 28 (1972) 105.
- O. K. Abiola, N. C. Oforka, E. E. Ebenso, and N. M. Nwinuka, Anti-Corrosion Methods and Materials, 54(4) (2007) 219–224
- M. Kliskic, J. Radoservic, S. Gudic, and V. Katalinic, Journal of Applied Electrochemistry, 30(7) (2000) 823–830
- A. Y. El-Etre, Corros.Sci. 40(11), (1998) 1845–1850
- A. Y. El-Etre, Corros. Sci, 45(11) (2003) 2485–2495
- A. Y. El-Etre, Appl. Surf. Sci., vol. 252(24) (2006) 8521–8525
- E. E. Ebenso, U. J. Ibok, U. J. Ekpe et al., Transactions of the SAEST, 39(4)(2004) 117–123
- E. E. Ebenso and U. J. Ekpe, West African Journal of Biological and Applied Chemistry, 41(1996) 21–27
- U. J. Ekpe, E. E. Ebenso, and U. J. Ibok, West African Journal of Biological and Applied Chemistry, 37(1994) 13–30
- F. Zucchi and I. H. Omar, 24(4) (1985)391–399
- S. A. Umoren, O. Ogbobe, I. O. Igwe, and E. E. Ebenso, 50(7), (2008) 1998–2006
- A.S. Fouda, R. Abo-Shohba, W. M. Husien & E. S. Ahmed, Global Journal of Researches in Engineering: C Chemical Engineering, 15(3) (2015) 9-24
- A.S.Fouda, A. Y. El-Khateeb, M. Ibrahim3 and M.Fakih, Nature and Science 13(2) (2015) 71-82
- A. A. Nazeer, K. Shalabi, A. S. Fouda, Res Chem Intermed 41(2015)4833–4850
- A. S. Fouda, H. E. Megahed, N. Fouad,N. M. Elbahrawi, J Bio Tribo Corros 2:16 (2016) 1-13
- I.H. Farooqui, A. Hussain, P.A.and Quarishi Saini, Anti-Corros., Meth. Mater. 46 (1999) 328.
- S. Martinez and I.Stern, J. Appl. Electrochem., 31(2001) 973.
- A., B Chetouani and M. Hammouti Benkaddour, pigm. Resin Technol., 33 (2004) 26.
- F. Bensabah, S. Houbairi, M.Essahli, A. Lamiri, Naja J., Port. Electrochim. Acta, 31(4) (2013) 195-206
- L.Valek and S. Martinez, Mater. Lett, 61 (2007) 148.
- OK. Abiola, NC Oforka, EE and NM ebenso Nwinuka, Anti-Corros. Mater, 54(2007) 219
- AM .Abdel-Gaber, BA. Abd-El-Nabey and M .Saadawy., Corros. Sci., 51(2009) 1038.
- G.N. Mu, , T.P. Zhao, , , M. Liu, T. Gu, , Corrosion 52, (1996) 853.
- A. Yurt, G. Bereket, A. Kivrak, A. Balaban and B. Erk ,J Appl Electrochem, 35(2005)
- G. Banerjee & S N. Malhotra, Corrosion. 48, (1992) 10
- T P. Hour & R D .Holliday, J Appl Chem., 3(1953) 502.
- L O (Jr). Riggs & T J. Hurd, Corrosion, 23 (1967) 252.
- G M. Schmid & H J. Huang, Corros Sci., 20 (1980) 1041.
- F. Bentiss, M. Lebrini & M. Lagrenee, Corros Sci., 47 (2005) 2915.
- J. Marsh, Advanced Organic Chemistry, 3rd edn (Wieley Eastern, New Delhi), (1988).
- D.C. Silverman and J. E.Carrico, Corrosion, 44 (1988) 280.
- W. J.Lorenz and F. Mansfeld, Corros.Sci. 21 (1981) 647.
- D. D. Macdonald, M. C. Mckubre., “Impedance measurements in Electrochemical systems,” Modern Aspects of Electrochemistry, J.O’M. Bockris, B.E. Conway, R.E.White, Eds., Plenum Press, New York, New York, 14(1982) 61.
- F. Mansfeld; Corrosion. 36 (1981) 301.
- C. Gabrielli,“Identification of Electrochemical processes by Frequency Response Analysis,”Solarton Instrumentation Group, (1980).
- M. El Achouri, S. Kertit, H.M. Gouttaya, B. Nciri , Y. Bensouda, L. Perez , M.R. Infante, K. Elkacemi, Prog. Org. Coat. 43 (2001) 267.
- J.R. Macdonald, W.B. Johanson, in: J.R. Macdonald (Ed.), Theory in Impedance Spectroscopy, John Wiley& Sons, New York, (1987).
- S. F. Mertens, C. Xhoffer, B. C. Decooman, E. Temmerman, Corrosion. 53 (1997) 381.
- G. Trabanelli, C. Montecelli, V. Grassi, A. Frignani, J. Cem. Concr., Res. 35 (2005)1804
- F. M. Reis, H.G. De Melo and I.Costa, Electrochim. Acta. 51 (2006) 17.
- M. Lagrenee, B. Mernari, M. Bouanis, M. Traisnel & F. Bentiss, Corros. Sci. 44 (2002), 573.
- Ma H., Chen S., Niu L., Zhao S., Li S., Li D., J. Appl. Electrochem. 32(2002) 65
- G. A. Caigman, S. K. Metcalf , E. M.Holt, J.Chem. Cryst. 30 (2000) 415.
- B.M. Lawrence Progress in essential oils: rosemary oil. Perfum. Flavor. 20(1) (1995) 47.
- K. Aramaki,; , N. J Hackermann. Electrochem. Soc.1969, 116, 568-571.
PDF Version of the article |
Flash Version of the article |
|
| [qrcode] | ||