
The Ni-Cd alloy coating was electrodeposited on mild steel (MS) from acid chloride bath using gelatin and glycerol as additives, individually and in combination. The bath composition and operating parameters have been optimized by conventional Hull cell method. The effect of current density (c.d.) on Ni content of the alloy was studied at different molar ratio of metal ions in the bath. The effects of c.d. and temperature on thickness, hardness, and composition and corrosion rate (CR) of the coatings were studied. Cyclic voltammetry (CV) study showed that (gelatin + glycerol) has significant effect on process of deposition and (gelatin + glycerol) worked synergistically to increase the Ni content by their preferential deposition and by suppressing the deposition of more readily depositable Cd2+ ions. Ni-Cd bath having both [Ni2+]/[Cd2+] = 1.5 and 8.0 exhibited anomalous type of codeposition at all c.d.’s studied. Corrosion behavior of the coatings evaluated by electrochemical methods demonstrated that the coating from bath [Ni2+]/[Cd2+] = 15, deposited at 4.0 A dm-2 is the most corrosion resistant. The superior corrosion resistance of Ni-Cd coatings at optimal c.d. was attributed to specific Ni (111), Ni (200), Cd (200) and Ni-Cd (862) reflections, evidenced by XRD study. The surface morphology was analyzed using SEM study, and results are discussed.
1. Introduction
The theory of codeposition of two or several metals is of particular interest, as the current trend in engineering and technology supports the replacement of individual metals by their alloys, which usually feature a wider spectrum of properties. This is particularly true in electroplating technology. Alloy electrodeposition is technically a more complicated process as compared to the deposition of individual metals, as it requires a more stringent control of the composition of electrolyte and deposition conditions as well as closer monitoring of these parameters; it also poses additional problems owing to anode operation. As a consequence, development of a new process of alloy deposition is overall a more complicated research and development issue [1].
Electrochemical method of alloy coating is attractive due to the high degree of control obtainable by varying the experimental conditions. Metals, alloys, and composite layers can be deposited electrochemically to form single or multicomponent layers. The recent interest in the electrodeposition of Ni-based alloys is due to their unique corrosion and thermophysical properties. Plentiful reports are available in the literature on electrodeposition of Ni-based alloy coatings for the protection of steel products against corrosion [2-13]; in which many new organic compounds have been proposed as additives to obtain durable, uniform, and compact Ni-based coatings for corrosion prevention. These organic molecules, or even mineral impurities added to the electroplating solution were known to exert crucial effect on corrosion characters and other properties. The effect of the organic molecules, with special emphasis on deposition process and physical characteristics of the electrodeposited alloys has been studied [14]. Experimental results demonstrated the fact that addition of additives not only alters the process of deposition but also the deposit characters by changing the phase structures.
As cathode current density is the driving force for the process of deposition, the coatings of specific properties can be fabricated by its proper manipulation [15, 16]. Generally during alloy plating, the codeposition of two metals requires reasonably close reversible potentials of the individual metals. This could be achieved by proper modulation of the bath composition, in terms of metal contents in the bath, certain additives, complexing agents of varying stability constant etc. [17]. In case of normal codeposition of two or more metals, more noble metal is preferentially deposited. The ratio of the more noble metal to less noble metal is larger than the relative concentration of the electrolyte [18]. However, anomalous type codeposition is characterized by preferential deposition of less noble metal over more noble metal [19, 20].
Today, cadmium plating banned due its high toxicity. Moreover, Cd plating is associated with another drawback of introduction of large amount of hydrogen into the underlying metal during deposition process which increases the risk of failure in the structure due to hydrogen embrittlement. Recently it has been reported that by introducing a third element (Cd) in the Zn-Ni alloy, the Zn content in the alloy can be decreased and consequently the corrosion potential of Zn–Ni alloy can be decreased drastically close to cadmium coatings. Accordingly, the environmental safety and performance of these coatings forced the researchers to look for an alternative for conventional Cd coatings. In this direction, an effort has been made to electrodeposit Ni-Cd coatings on to the surface of mild steel to achieve high performance against corrosion [21, 22].
In view of many reports on electrodeposition and characterization of Ni-Cd alloy coatings under different conditions of bath composition and operating parameters, the present work is to understand the effect of two organic additives, namely gelatin and glycerol (both as individual and in combination) on deposition process. Efforts have been made to understand the role of additives in better corrosion resistance of the coatings, without being increasing the Ni content of the alloy. The synergistic effects of additives on cathode current efficiency (CCE), alloy composition and corrosion resistance have been studied and results are discussed.
2. Materials and Methods
Electrolytic solution having, NiCl2.6H2O, CdCl2 and boric acid were freshly prepared using laboratory grade chemicals and double distilled water. NH4Cl was added to increase the conductivity and ionic strength of the electrolyte. The filtered electrolyte solution was used each time. Gelatin and glycerol was used in combination as additives to impart uniformity and brightness to the coating. Gelatin (primary brightener) being insoluble in cold water, it was dissolved in hot water, and then added to bath in required quantity. The computer controlled power source (DC Power Analyzer, Agilent Technologies, Model: N6705) was used for electrodeposition. All depositions were carried out on pre-cleaned mild steel (MS) panels having 7.5 cm2 active surface area. The surface was degreased by an alkali cleaner prior to coating.
All depositions were carried out for 10 minutes at 303 K and pH = 4.0, for comparison purpose. Pure Ni plate was used as anode with same exposed area as cathode. The deposition was performed in a rectangular PVC cell with 250 cm3 electrolyte solution capacity. All depositions were performed under identical stirring condition to maintain same mass transport at cathode. No nitrogen (or other gas) purging was made either before or during deposition. The Hull cell method was used to set operating parameters (in terms of c.d., temperature, pH) and bath compositions (in terms of salt concentration, additives) as detailed elsewhere [23]. Hull cell experiment demonstrated that when only glycerol was used, no bright and homogeneous Ni-Cd coating was deposited at wide range of c.d. Hence to get smooth and uniform Ni-Cd alloy coating, a known amount of gelatin was added into the bath. The composition and other parameters used for development of bright Ni-Cd alloy coating on MS panel is shown in Table 1.
Tab. 1: Composition and operating parameters of the proposed Ni-Cd bath having (gelatin + glycerol) as additives
The cyclic voltammetry (CV) study was carried out in a conventional three electrode cell. While studying the CV, two Pt electrodes (one as working electrode, and other one as counter electrode) with a surface area of 1 cm2 were used. Before each experiment, the working electrode was activated by immersion in 1:1 HNO3. Although this is a different material than the MS (substrate) used for galvanostatic deposition, it enabled the elimination of noise in CV experiments. All potentials measured in this work are with regard to saturated calomel electrode (SCE), having ESCE = 0.2422 V. The experiments were carried out in still solution without stirring to ensure the mass transport through only diffusion. The composition and pH of the bath used for CV study is shown in Table 1. The bath temperature was stabilized at 298 K (25 °C). The CV experiments were conducted in a quiescent solution without N2 purging, at scan rate, υ = 100 mV s-1.
The effect of operating parameters like c.d., temperature on the codeposition of Ni2+ and Cd2+ ions have been studied. The bath allowed codeposition of coatings in range of 1.0 – 7.0 A dm-2, having black-porous/powdery, semi-bright to bright appearance. At very high c.d., the coatings were found to be very powdery, and peeled-off from the substrate. The corrosion performances of the coatings were evaluated by both electrochemical DC (Potentiodynamic polarization) and AC (Electrochemical Impedance Spectroscopy, EIS) methods, using Potentiostat/galvanostat (ACM Instruments, Gill AC Series No-1480). All corrosion studies were made in 5 % NaCl at 298 K (25 °C), exposing only 1 cm2 coated surface area, used as working electrode. The Pt electrode with same surface area as that of working electrode was used as counter electrode. The EIS study was made in the frequency range of 100 kHz-10 MHz using sine wave of ±10 mV amplitude, and correspondingly Nyquist plots were plotted. The potentiodynamic polarization study was carried out at scan rate of 1 mV s-1, in a potential window of ± 250 mV from open circuit potential (OCP). All corrosion rates (CR’s) were expressed in units of mm y-1, determined by Tafel’s extrapolation method [24].
The corrosion rate was calculated using the following equation [25]:
Equation 1.1
where, constant K = 0.00327 defines the unit of corrosion rate (mm y-1), icorr is the corrosion current density in µA cm-2, ρ is the density of the corroding material, EW is the equivalent weight of the alloy calculated using equation shown below:
Equation 1.2
where fi is the weight fraction of the ith element in the alloy, Wi is the atomic weight of the ith element in the alloy and ni is the valence of the ith element of the alloy [25].
The cathode current efficiency (CCE) for alloy deposition or Faradaic efficiency was calculated using the mass gained, the charge transferred and the chemical composition of the deposit:
Equation 1.3
where w is the measured mass of the deposit in grams, t is the time of deposition in seconds, I is the average applied current strength (in Amperes), EW is the equivalent weight of the alloy (g equiv-1), ci is the weight fraction of the element in the alloy deposit, ni is the number of electrons transferred per atom of each metal, Mi is the atomic mass of that element and F is the Faraday’s constant (96,485 C mol-1). Scanning Electron Microscope (SEM, Model JSM-6380 LA from JEOL, Japan) interfaced with Energy Dispersive X-Ray (EDX) facility, was used to examine the surface morphology and composition of the coatings. Each sample was analyzed at five locations, to confirm the uniformity in composition. Hardness of the coating (of about 20 μm thickness) was measured using a computer controlled Micro-Hardness Tester (MMT-X7, Clemex). While the thicknesses of coatings were estimated by Faraday’s law and were verified by measuring using Digital Thickness Meter (Coatmeasure – M&C, AA Industries Instruments). The phase structure of the coatings were analyzed using X-ray Diffractometer (XRD, JEOL JDX-8P) using Cu Kα– radiation, λ 1.5405 = А0, 30 kV.
3. Result and Discussion
3.1 Effect of gelatin and glycerol
The cyclic voltammetry (CV) study was made to identify the role of gelatin and glycerol on the process of co-deposition of Ni-Cd alloy, individually and in combination. Cyclic voltammograms corresponding to different conditions of additives, without additives (a), only gelatin (b), only glycerol (c), and (gelatin + glycerol) (d) are shown in Figure 1.
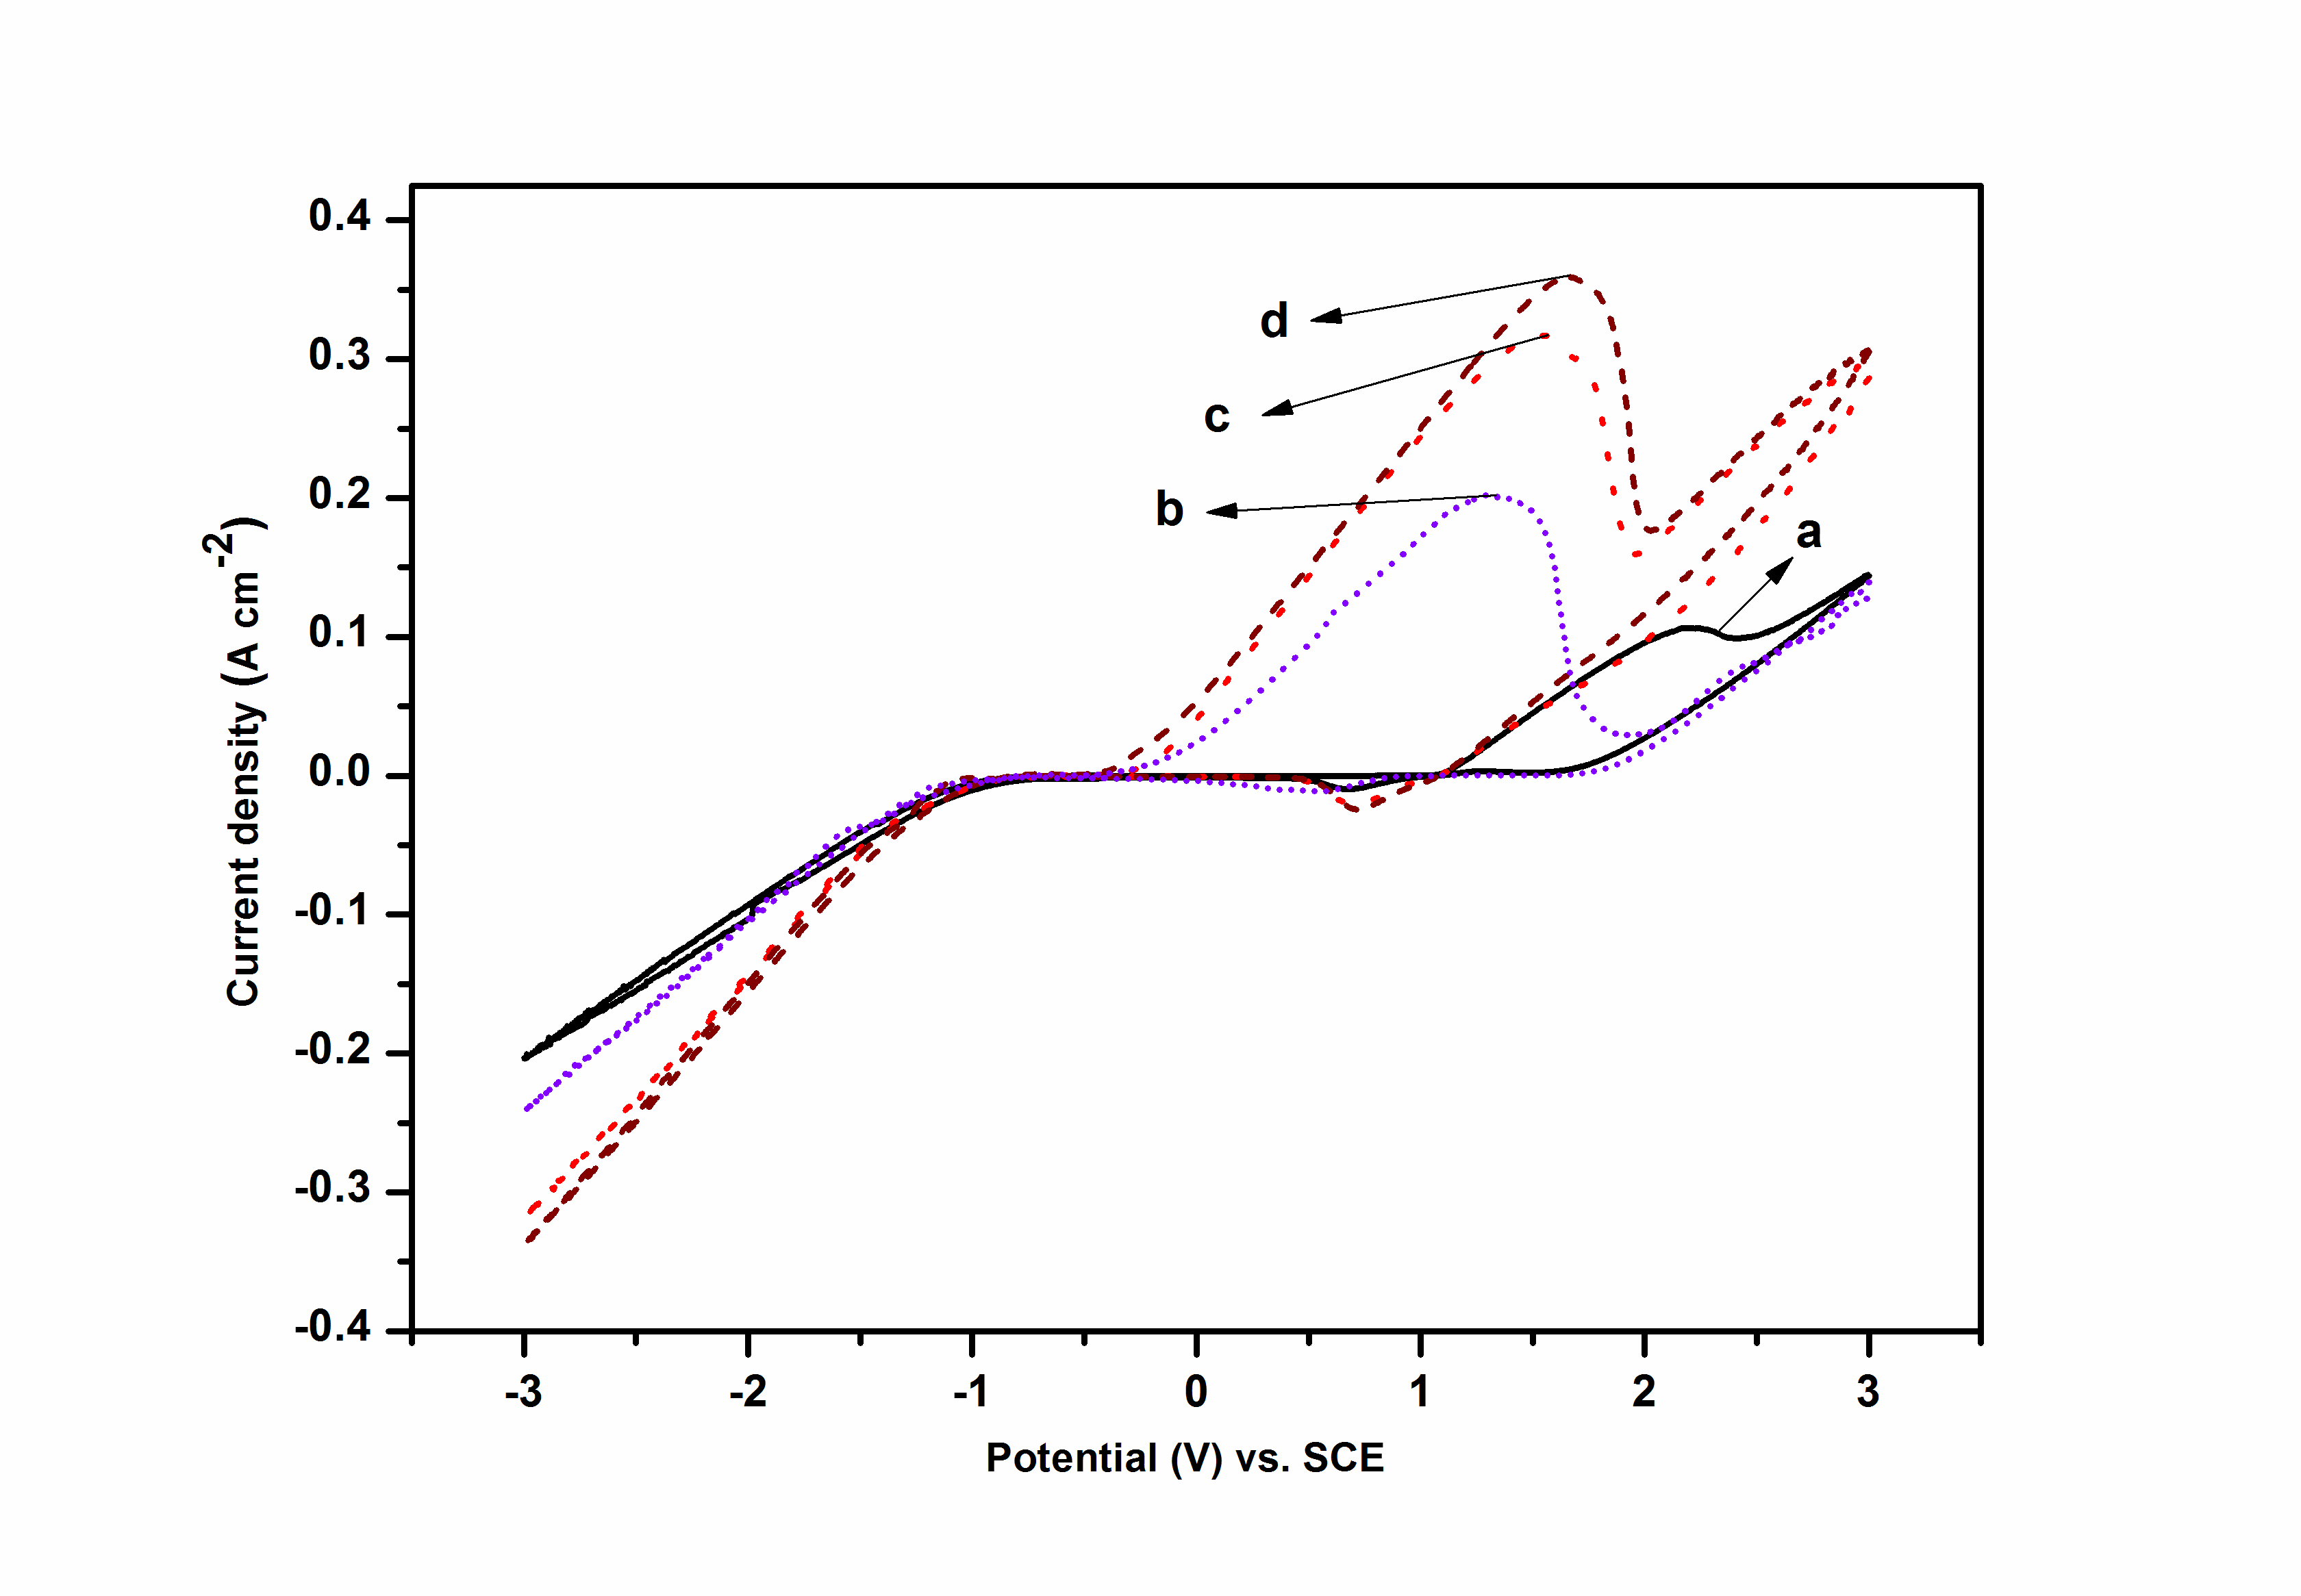
Fig. 1: Cyclic voltammogram for Ni-Cd bath demonstrating the effect of additives on process of deposition: a) without additives, b) with gelatin c) with glycerol and d) (gelatin+ glycerol). Working electrode: platinum foil, T = 298 K (25 °C) and pH = 4.0 at scan rate, υ = 100 mV s-1
The shape of CV confirmed that the presence of additives has significant role on process of deposition. The CV for only metal ions, i.e. in the absence of additives, shown in Figure 1a corresponds to the deposition of Cd(II) to Cd(0) and Ni(II) to Ni(0). It was observed that on addition of additives the anodic sweep was found to exhibit one distinct peak at different potentials, indicating the dissolution of Ni-Cd alloy of different phase structure such as Cd (002), Cd (100), Cd (101), Ni (111), Cd (102), Ni (200), Cd (103), Cd (110), Cd (112), Cd (200) and Ni-Cd (862), as shown by curves b, c and d in Figure 1. It may be noted that on addition of gelatin, the anodic peak potential has shifted to more negative direction starting at around -0.4 V. Further, addition of glycerol changed drastically the nature of CV by shifting the anodic peak potential to more noble side as shown in curve 1c, indicating the formation of alloy of different space lattice.
The variations of Ni content with c.d. under different conditions of additives are reported in Table 2. It may be noted that at a particular c.d., Ni content of the alloy increased progressively as the additive is changed from gelatin to glycerol, and then to (gelatin+ glycerol). At all c.d. studied, the Ni content in the alloy is maximum when deposition was carried out in presence of (gelatin + glycerol) as shown in Table 2. Hence, it may be concluded that gelatin and glycerol in combination, i.e. (gelatin+ glycerol) play important role in increasing the Ni content of the alloy. Hence it may be stated that (gelatin + glycerol) play an important role in imparting the better corrosion resistance (to be seen in later sections) by enhancing the Ni content in the alloy. Further, the coating was observed to be more bright and homogeneous in presence of additive in combination, than as individual.
3.2 Effect of molar ratio of [Ni2+]/[Cd2+]
The CV study was carried out under different molar ratio of the metal ions in the bath, i.e. [Ni2+]/[Cd2+] as 1.5, 8.0 and 15 and are shown in Figure 2. It may be observed that the anodic peak current intensity increased with molar ratio of Ni and Cd ions in the bath. It indicates that concentration of more noble metal ions, i.e. Ni2+ ions bears a close relation on the process of both dissolution and deposition of the alloy. However, the small change of anodic peak current intensity, observed in curves a, b and c with significant increase of molar ratio of metal ions may be attributed to the presence of NH4Cl, added as conducting salt.
![Fig. 2: Cyclic voltammogram showing deposition and dissolution of Ni-Cd alloy coatings under different molar concentrations of metal ions in the bath, when [Ni2+]/[Cd2+] = 1.5, a) [Ni2+]/[Cd2+] = 8.0, b) and [Ni2+]/[Cd2+] = 15, c). Working electrode: platinum foil, T = 298 K (25°C) and pH = 4.0 at scan rate, υ = 100 mV s-1](https://www.jept.de/wp-content/uploads/2014/04/fig2.png)
Fig. 2: Cyclic voltammogram showing deposition and dissolution of Ni-Cd alloy coatings under different molar concentrations of metal ions in the bath, when [Ni2+]/[Cd2+] = 1.5, a) [Ni2+]/[Cd2+] = 8.0, b) and [Ni2+]/[Cd2+] = 15, c). Working electrode: platinum foil, T = 298 K (25°C) and pH = 4.0 at scan rate, υ = 100 mV s-1
It is well known that Ni-Cd alloy coating exhibits both anomalous and normal type co-deposition, depending upon the c.d. and molar ratio of the metal ions present in the bath [26]. Hence, as an effort to change the general anomalous type of codeposition to normal type, the deposition was carried out at different c.d. by formulating different molar ratio of metal ions, i.e., [Ni2+]/ [Cd2+] = 1.5, 8.0 and 15, and corresponding results are shown in Figure 3. The wt. % Ni in the bath were found to be respectively, 43.9, 80.6 and 88.6 %, and are shown correspondingly by horizontal lines in Figure 3. It may be noted that in baths having molar ratio = 1.5 and 8.0, the wt. % Ni in the deposit is found to be always less than that in the bath, regardless of the c.d. employed for its deposition, indicating the fact that baths follow anomalous type of co-deposition. However, when the molar ratio = 15, the deposition process has changed to normal type, at least towards high c.d., by exhibiting high Ni content in the deposit than in the bath. This observation is once again supported by the peak current potentials of CV’s shown in Figure 2. Hence, the increase of Ni content in the deposit at high molar ratio of ions indicated that at this condition the anomalous codeposition is suppressed. In other words, normal codeposition tends take place with favored deposition of noble Ni [19].
![Fig. 3: Variation in wt. % Ni in the deposit with c.d., deposited from baths having different molar ratio of ions, i.e.[Ni+2]/[Cd+2] = 1.5, 8.0 and 15. Corresponding horizontal lines represents the wt. % Ni in the bath](https://www.jept.de/wp-content/uploads/2014/04/fig3.png)
Fig. 3: Variation in wt. % Ni in the deposit with c.d., deposited from baths having different molar ratio of ions, i.e.[Ni+2]/[Cd+2] = 1.5, 8.0 and 15. Corresponding horizontal lines represents the wt. % Ni in the bath
Further, it may be noted that the increase in the molar ratio of the metal ions decreased the limiting current density (jL) as shown by the arrow mark in Figure 3. Here limiting current density may be recalled as the maximum c.d. required for achieving a desired electrode reaction before hydrogen or other extraneous ions are discharged simultaneously. In the present study, it was observed that an increase in the molar ratio of ions in the bath has an adverse effect on the current efficiency of bath, supported by literature [23].
3.3 Effect of current density
As mentioned earlier, wt. % Ni in the deposit was found to be increased with c.d. (from 1.0 to 6.0 A dm-2). The variations of Ni with c.d., under different conditions of additive are summarized in Table 2. At a particular c.d., increase of Ni content in the coating, deposited in the presence of additives is in the order of (gelatin + glycerol) > glycerol > gelatin as shown in Table 2. A drastic increase of Ni content with change of additives indicated their vital role on deposition by changing the process of nucleation. Further, the coating was found to be bright and uniform when (gelatin + glycerol) was used as additive. This is further confirmed by the peak current potential observed in CV, shown in Figure 1d.
It may be seen from Figure 3 that at low c.d., the deposition of more noble metal, namely Ni was suppressed. In other words, deposition of less noble Cd was preferred, compared to its content in the bath. But on increasing the current density (above 4.0 A dm-2), the process of deposition was changed to normal type with preferential deposition of Ni. Hence it may be inferred that at low c.d., the bath follows anomalous type codeposition, which changed to normal type at high c.d. However, on further increasing the c.d., the Ni content started to decrease and tended to reach that of in the bath. This decrease of Ni content is due to the fact that when the deposition c.d. of Ni is moving away from its limiting current density (jL) value, which is obviously different from that of Cd [26]. Hence, decrease of Ni content at high c.d. is a measure of deviation of deposition c.d. from limiting c.d. of the bath. In other words, Ni content of the alloy is function of both deposition c.d. and limiting current density of the bath.
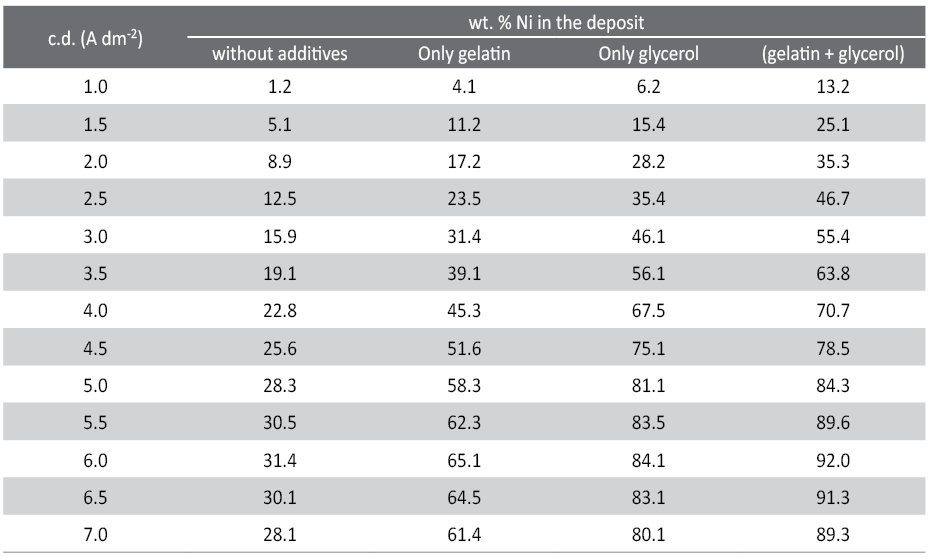
Tab. 2: Variation of Ni content in the alloy with current density (c.d.) under different conditions of additives at 303 K (30 °C)
3.4 Effect of c.d. on thickness and hardness
The variation in thickness and micro-hardness of the coatings with c.d. in presence of (gelatin + glycerol) is shown in Table 3. It was observed that thickness of the coatings increased continuously with applied c.d. as shown in Table 3. This may be attributed to the combined effect of increased hydroxide formation (as featured by anomalous codeposition due to local alkalinity at the cathode layer caused by excess hydrogen evolution) and Faraday’s law. The microhardness of the coatings was observed to be increased with c.d. as shown in Table 3. It is partly due to increased % Ni content (the harder metal) and partly due to smooth, uniform and homogeneous deposit caused by the the synergistic effect of gelatin and glycerol, as additives. However, decreased hardness at extremely high c.d. (7.0 A dm-2) is due to increased porosity caused by local alkalinity due to hydrogen gas evolution during plating.
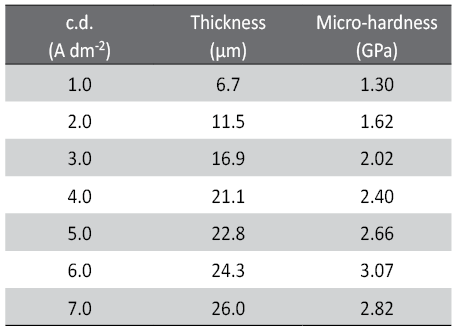
Tab. 3: Effect of current density (c.d.) on thickness and Micro-hardness of Ni-Cd coatings, deposited from optimal bath
3.5 Effect of temperature
In both anomalous and normal type alloy plating, temperature of the bath plays an important role on deposit characters such as their appearance, composition and phase structure. The variation of Ni content with temperature in present study was tested by evaluating the composition of coatings, deposited at different temperatures from 293 K (20 °C) to 333 K (60 °C) over wide range of c.d., i.e. from 1.0 to 7.0 A dm-2 and is shown in Figure 4. The horizontal line represents wt. % Ni in the bath (about 88.6 %), calculated from the bath composition. The wt. % Ni in the deposit was observed to be increased with both temperature and c.d. as observed in other Ni-Cd baths. However, decrease of Ni content at low temperature (293K (20°C)) and very high c.d. is due to increase in the rate of diffusion and convection of more readily depositable metal (Cd) at the diffusion layer [26]. Further at very high temperature, Ni content in the alloy was observed to be more than that in the bath, i.e., Ni content is above the horizontal line. It indicates the fact that bath follow normal type of co-deposition. Therefore the transition of anomalous type deposition to normal type, or vice versa is a function of both temperature and c.d. employed.

Fig. 4: Variation in wt. % Ni in the deposit with c.d., deposited from optimal bath maintained at different temperatures (Horizontal line represents the wt. % Ni in the bath)
The variation of cathode current efficiency (CCE) with applied c.d. at different temperature is shown in Figure 5. It may be noticed that the CCE decreases with c.d. up to a certain optimal c.d. and then increases. At low temperature and c.d., the CCE was found to be higher than 100%. This may be due to the precipitation of metal hydroxides and subsequent incorporation in the deposit [26]. However, an increase of both temperature and c.d. results in decrease of CCE as shown in Figure 5, and it may be attributed to excessive hydrogen evolution.
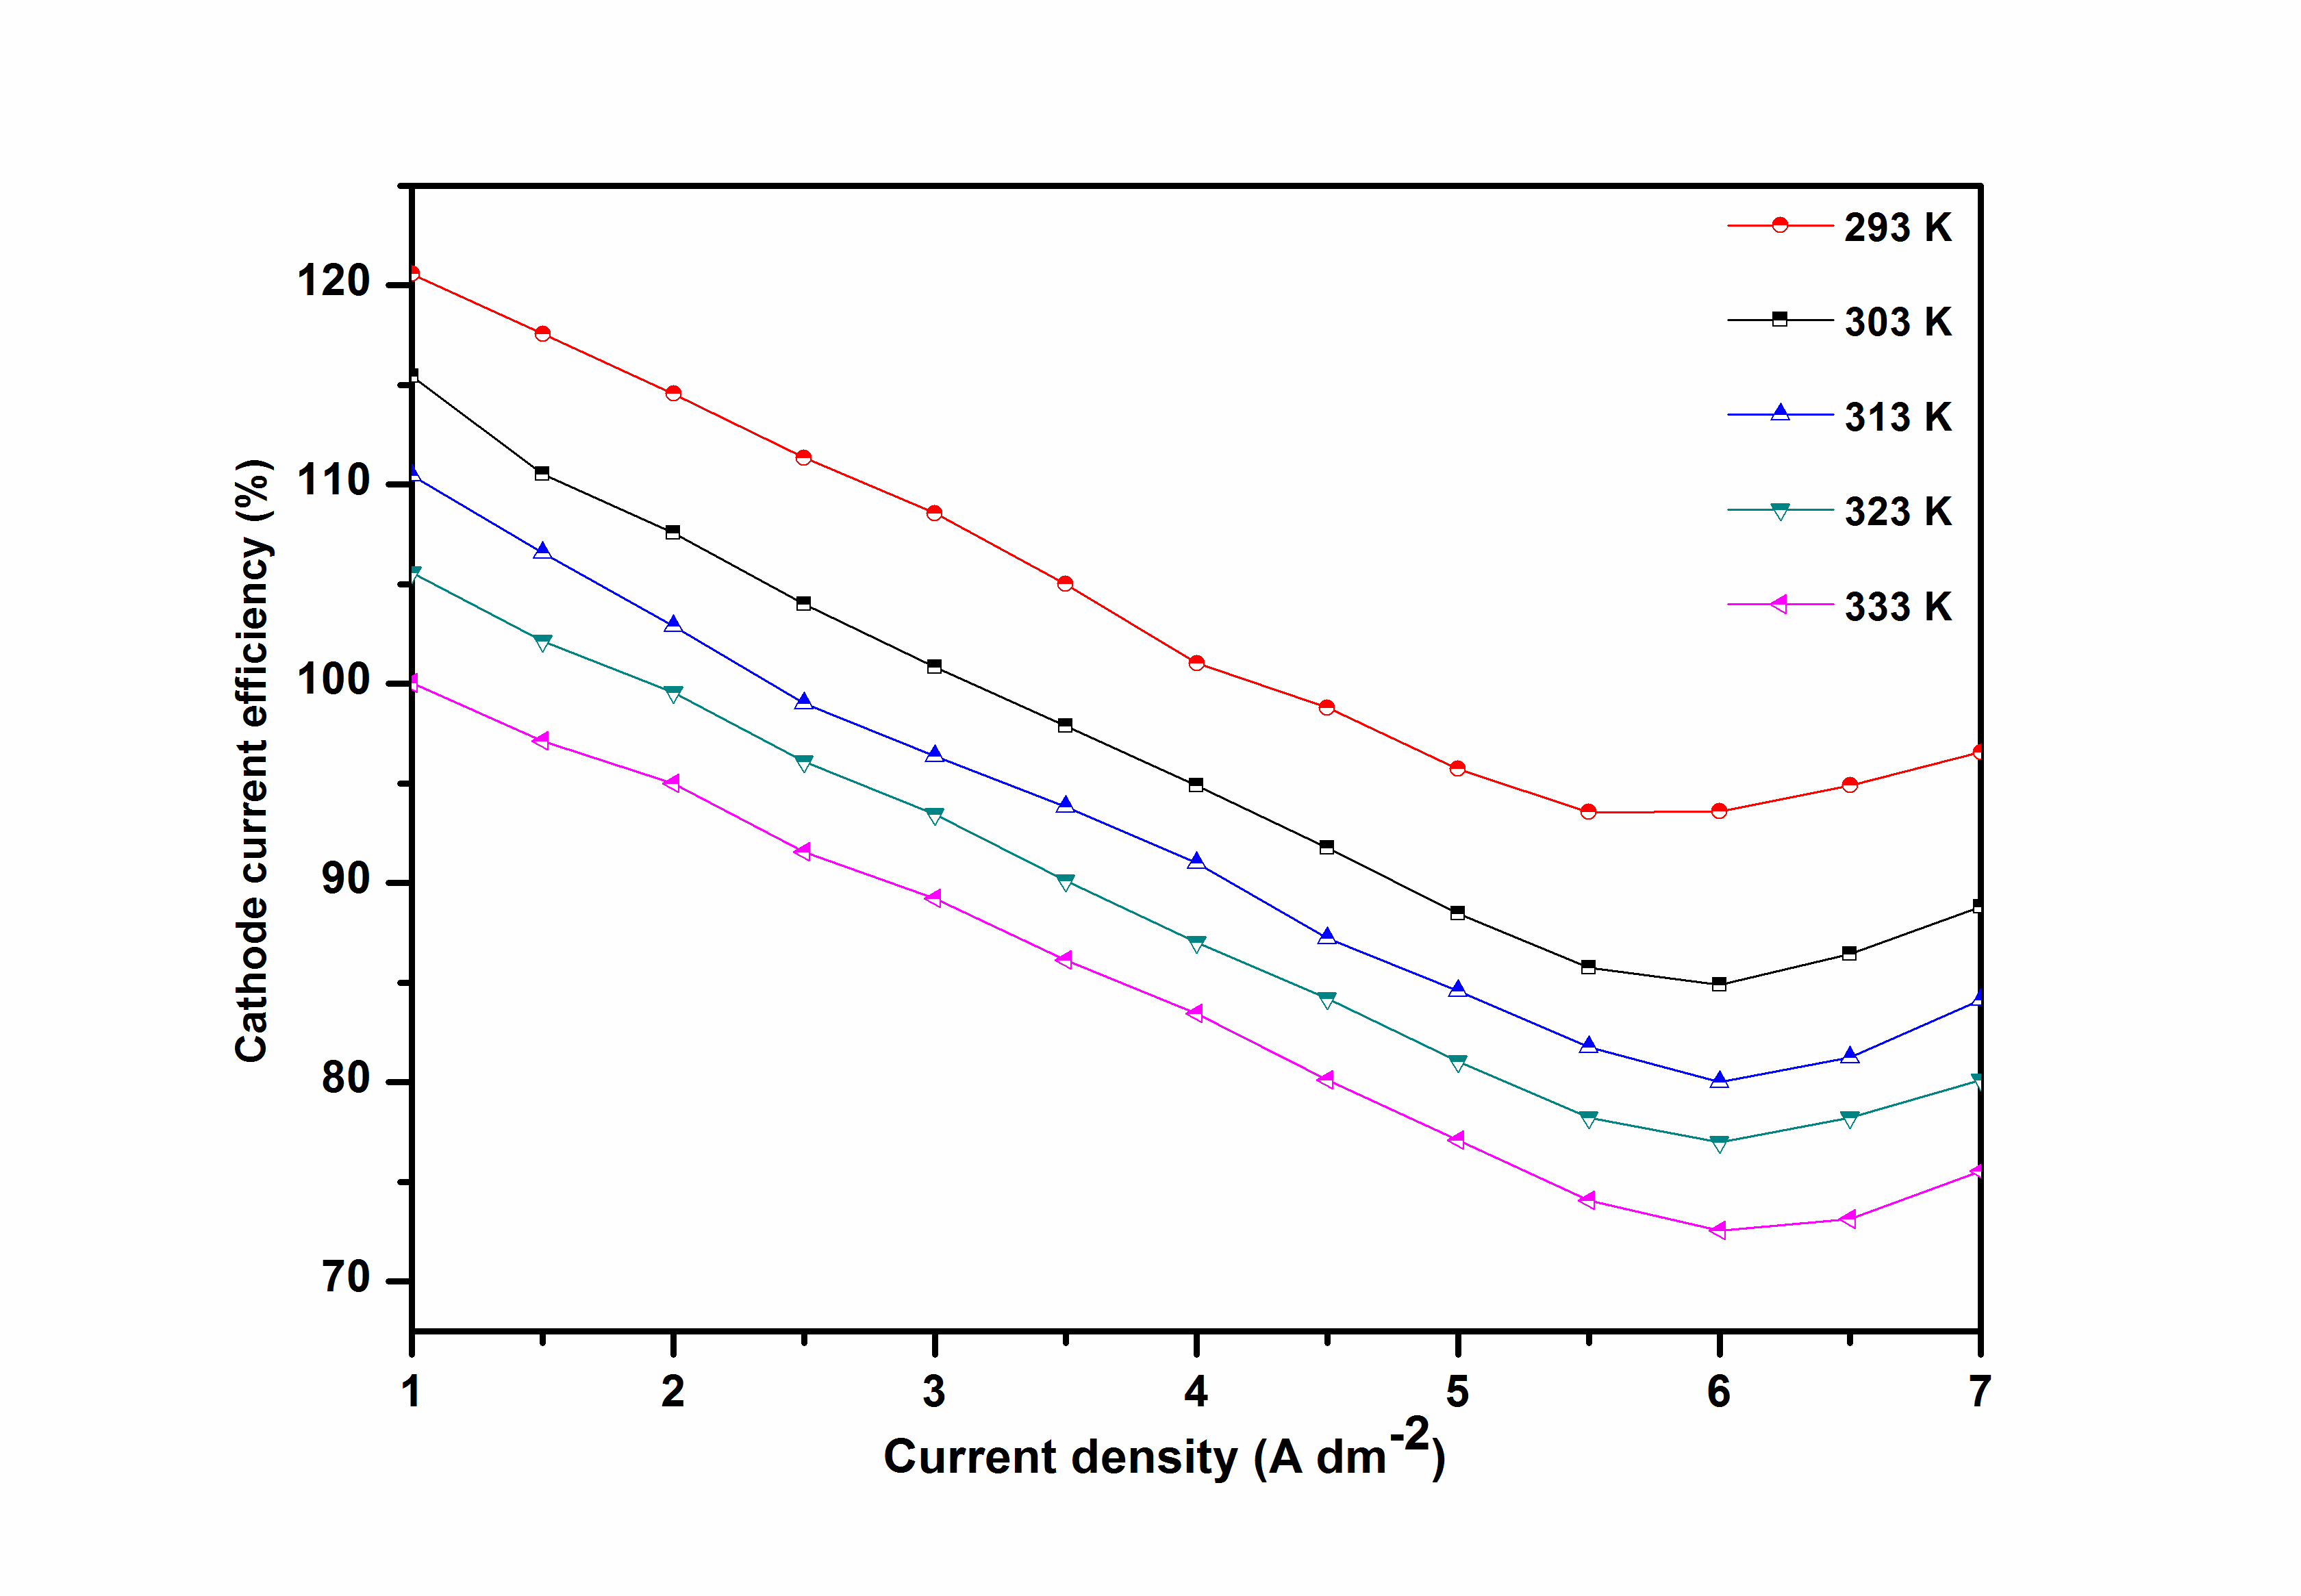
Fig. 5: Variation of cathode current efficiency (CCE) with current density, and bath temperature (corresponds to optimal bath)
3.6 Corrosion study
3.6.1 Polarization study
The corrosion behavior of Ni-Cd coatings deposited at different c.d. was evaluated by subjecting them to polarization study [27]. Corrosion rates (CR’s) were calculated by Tafel’s extrapolation method, and corresponding plots are shown in Figure 6. The observed corrosion potential (Ecorr), corrosion current density (icorr) and CR are reported in Table 4. It may be observed that CR decreased with c.d. only up to 4.0 A dm-2 and then increased. The corrosion data revealed that the Ni-Cd coating corresponding to 4.0 A dm-2, having ~ 70.77 wt. % Ni was found to exhibit the least CR. Thus enhanced corrosion protection of Ni-Cd alloy coating at optimal c.d. can also be supported by its specific phase structure supported by XRD study.
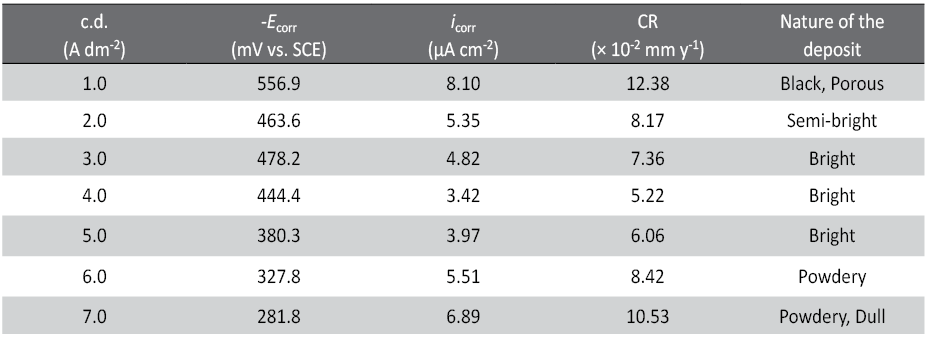
Tab. 4: Corrosion parameters of monolayer Ni-Cd coatings deposited at different current density from optimal bath
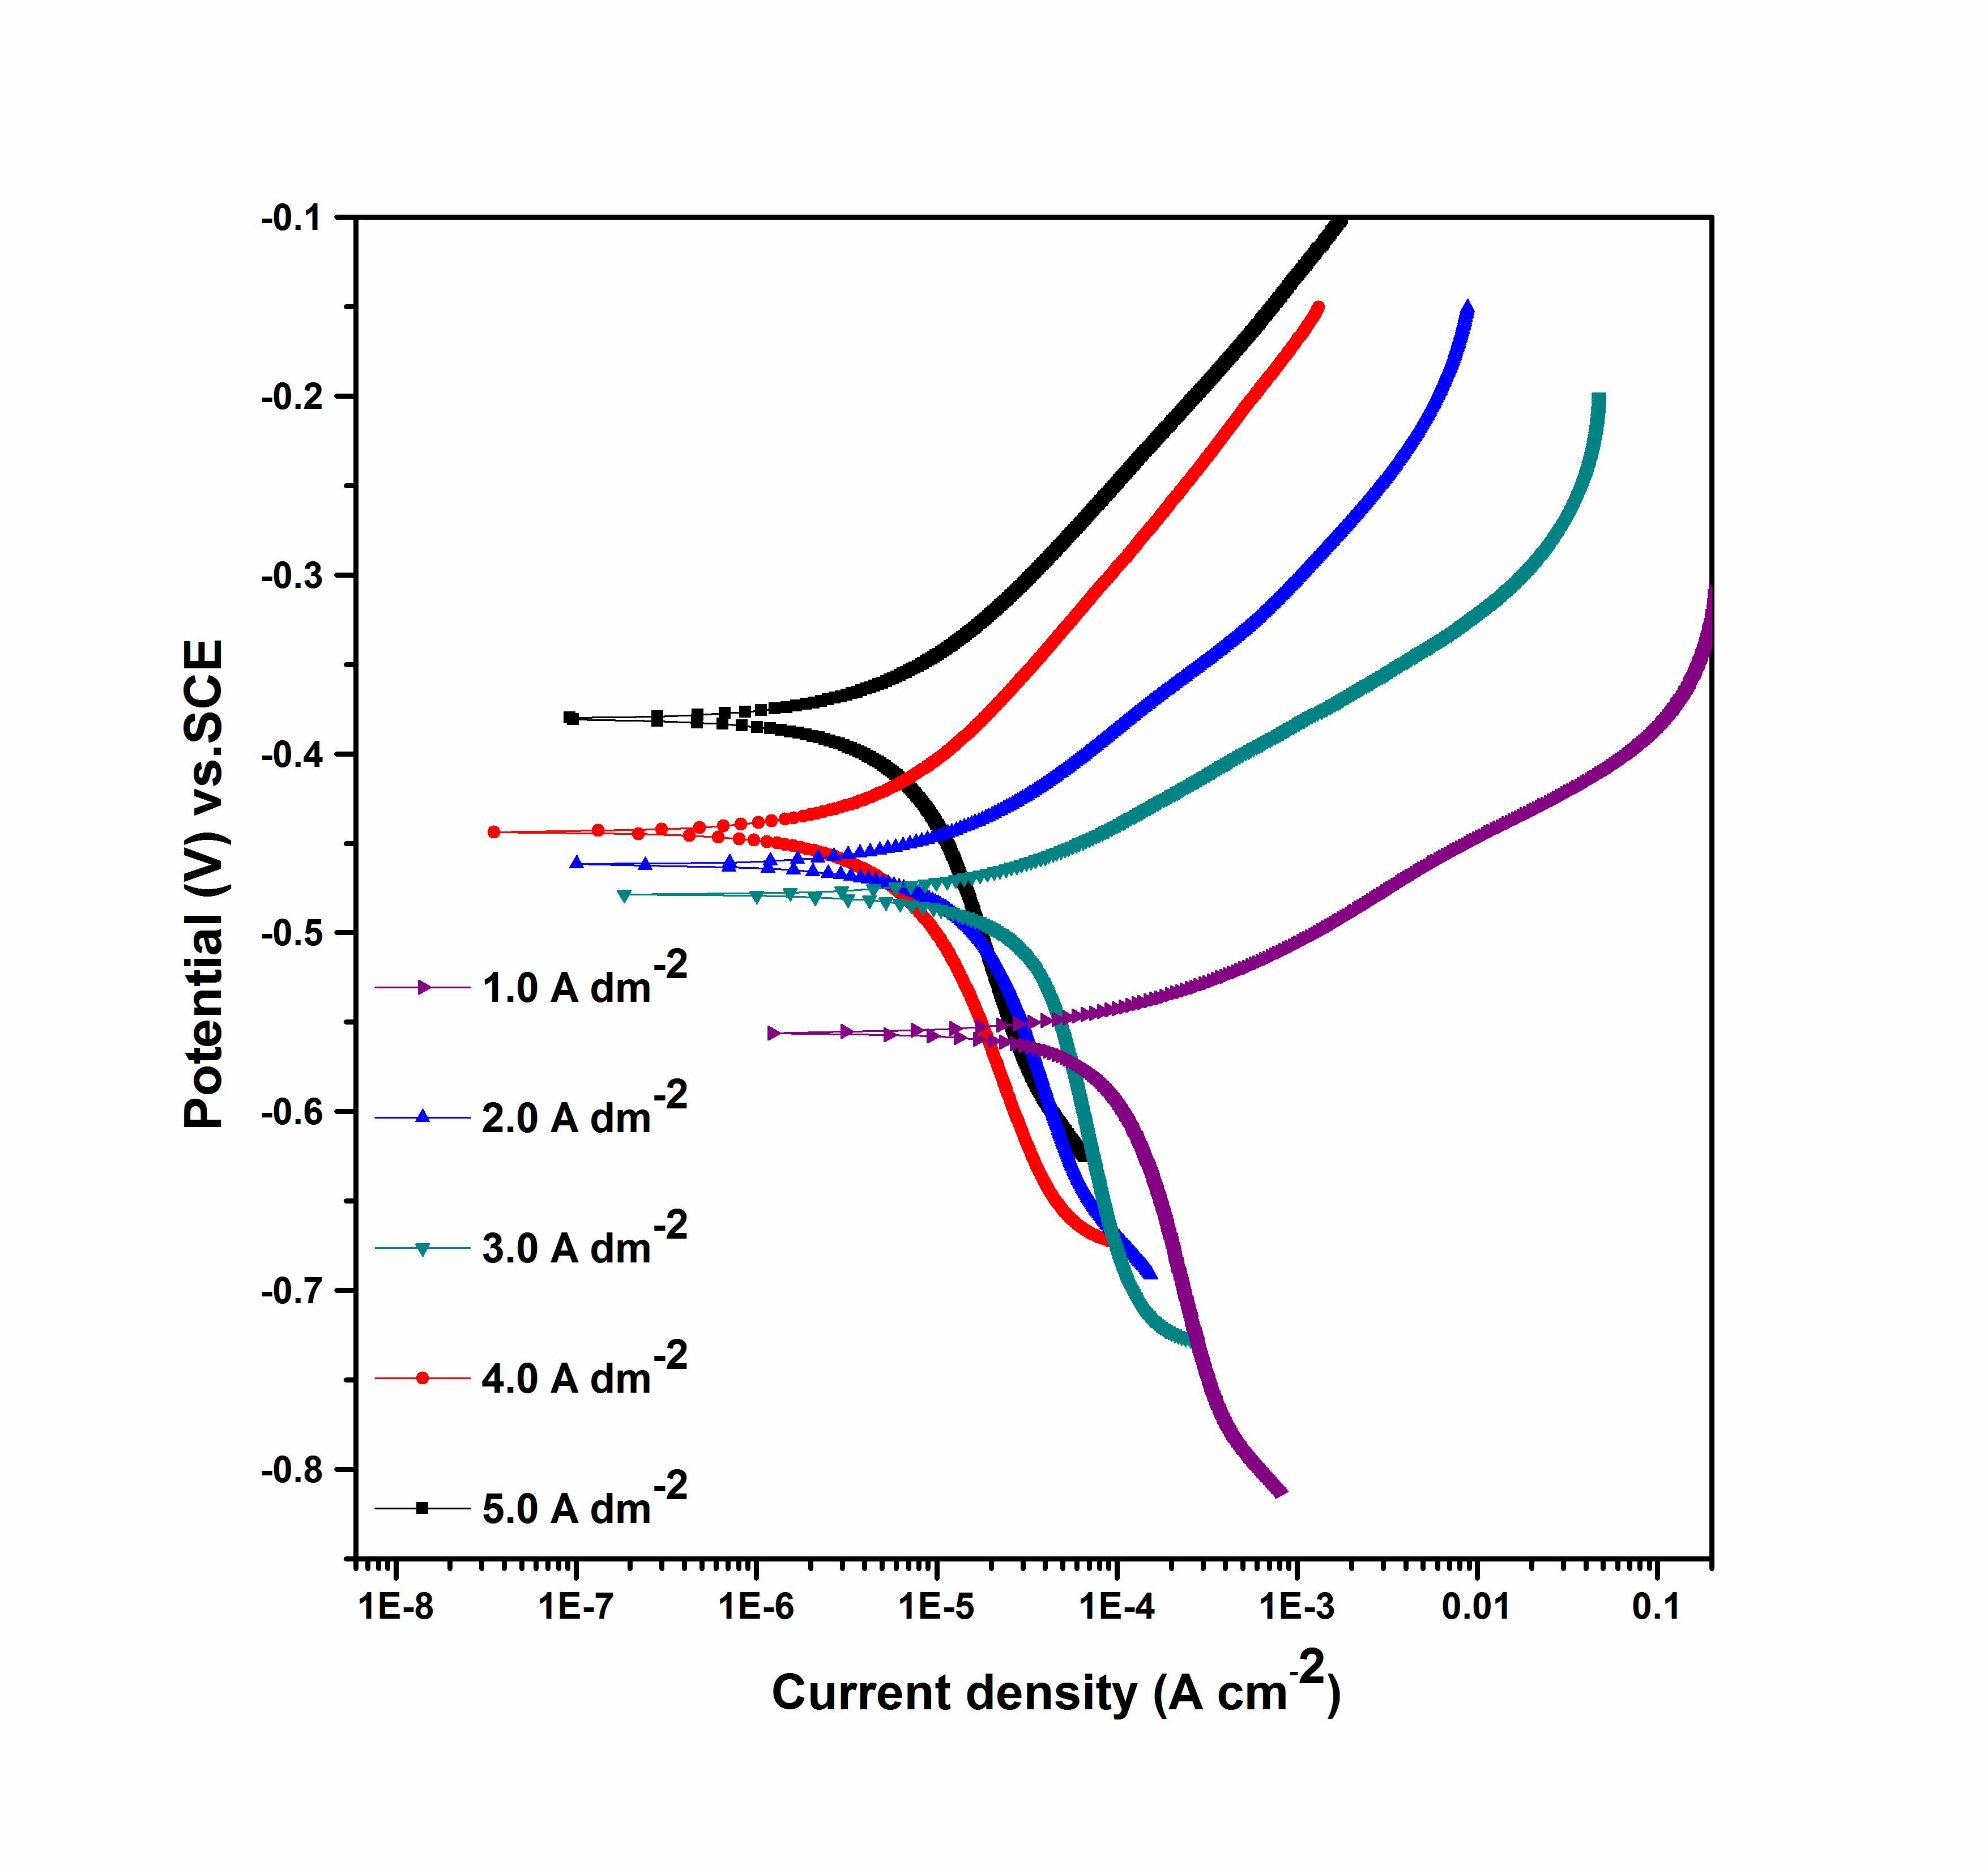
Fig. 6: Potentiodynamic polarization behaviors of the Ni-Cd alloy coatings deposited at different c.d.
3.6.2 EIS study
Electrochemical systems can be studied with methods based on impedance measurements. These methods involve the application of a small perturbation, whereas in the methods based on linear sweep or potential step the system is perturbed far from equilibrium. This small imposed perturbation can be of applied potential, of applied current or, with hydrodynamic electrodes, of convection rate. The response to the applied perturbation, which is generally sinusoidal, can differ in phase and amplitude from the applied signal. Measurement of the phase difference and the amplitude (i.e. the impedance) permits analysis of the electrode process in relation to contributions from diffusion, kinetics, double layer, coupled homogeneous reactions, etc. There are important applications in studies of corrosion, membranes, ionic solids, solid electrolytes, conducting polymers, and liquid/liquid interfaces [24].
In the present study EIS technique was used as an additional tool to evaluate the corrosion behavior of coatings. In EIS the most versatile tool is the Nyquist plots which commonly plot the data as imaginary impedance, Zimg verses real impedance Zreal with the provision to distinguish the contribution of polarization resistance (Rp) verses solution resistance (Rs) [24]. The Nyquist and Bode plots of Ni-Cd coatings, deposited at different c.d.’s are shown in Figure 7a and 7b respectively. The capacitive loop found at high frequency limit in Figure 7a indicated that the corrosion protection of the coatings is due to double layer capacitance (Cdl). Further, an increase in the radius of semicircle with c.d. indicated that CR bears a close relation with c.d. employed for its deposition. The maximum diameter of the capacitive loop at optimal c.d. (4.0 A dm-2) demonstrated that the deposit is most corrosion resistant. It may be observed from Bode’s magnitude plot (Figure 7b) that the phase angle (θ) increases progressively with c.d. up to 4.0 A dm-2, and then decreases. This increase of θ with c.d. (only up to 4.0 A dm-2) once again supports the fact that corrosion protection efficacy of Ni-Cd coatings under optimal condition is due to increased capacitive character of the double layer [28, 29].

Fig. 7: EIS response for Ni-Cd alloy coatings (a) Nyquist plot and b) Bode magnitude plot at different c.d., deposited from the optimized bath at 303 K (30°C)
3.7 SEM study
The Scanning Electron Microscopy (SEM) image of the Ni-Cd alloy coatings at different c.d. is shown in Figure 8. The surface morphology of the coatings changed drastically with c.d. employed as shown in from Figure 8a through 8e. Surface morphology of the coatings indicates that c.d. plays significant role on crystal orientation of the deposit. The coatings were observed to be very rough and porous at very low c.d. side, with flowery structure as shown in Figure 8a-8c. This flowery structure may be attributed to high Cd content (or less Ni content) of the alloy as reported in Table 2 as (Figure 8a). However, as c.d. is increased, the uniformity of coatings increased drastically as shown in Figures 8d and 8e. However, at 4.0 A dm-2, Ni-Cd coating was observed to be more bright, uniform and homogeneous.
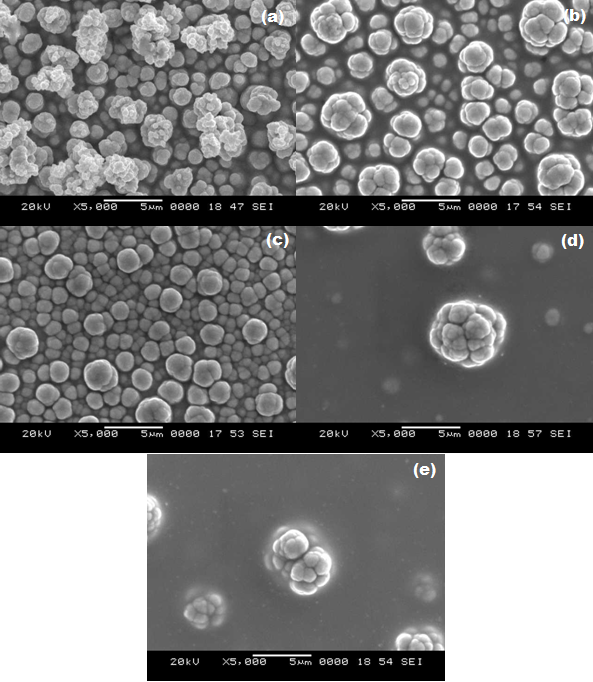
Fig. 8: SEM image of Ni-Cd alloy coatings deposited at a) 1.0 A dm-2 b) 2.0 A dm-2 c) 3.0 A dm-2, d) 4.0 A dm-2 and e) 5.0 A dm-2, deposited from optimal bath at 303 K (30°C)
3.8 XRD Studies
The corrosion performance of the coatings at different c.d., can be related to their Ni content, and consequently their phase structures. The XRD patterns of the coatings corresponding to different c.d. are shown Figure 9. The least CR exhibited by the deposit at optimal c.d. (having about 70.77 wt.% Ni) is attributed to Ni (111), Ni (200), Cd (200) and Ni-Cd (862) phase structures. This particular phase structure, which could be deposited only in the presence of both additives, is responsible for better uniformity and homogeneity and hence the least CR of the coating.

Fig. 9: X-Ray Diffraction peaks of Ni-Cd alloy coating deposited at different c.d., deposited from optimal bath at 303 K (30°C)
Further, it may be noted that the peak corresponding to Cd (002), Cd (100), Cd (101), Cd (102), Cd (103), Cd (110) and Cd (112) phases were highly suppressed as the c.d. is increased from 1.0 A dm-2. However, the intensity corresponding to Cd (200) and Ni-Cd (862) phase decreased progressively with c.d. as shown in Figure 9. Further, a new Ni (111) phase structure was observed at only 4.0 and 5.0 A dm-2, indicating the formation of Ni-Cd alloy of high Ni content. Thus the least CR of Ni-Cdcoatings at optimal c.d. is due to its unique phase structure.
4. Conclusions
Based on experimental observation while studying the effect of additives and operating parameters on deposit characters the following observations were made as conclusions:
- A stable bath has been proposed for deposition of bright Ni-Cd alloy coating on MS using (gelatin + glycerol) as additives. The usage of additives in combination is more advantageous than using them individually from the corrosion protection efficacy point of view.
- Gelatin and glycerol worked synergistically to increase the Ni content in the alloy by their preferential deposition, and suppressing the deposition of more readily depositable Cd+2 ions.
- Cyclic voltammetry study demonstrated that (gelatin + glycerol) impart the deposition of Ni-Cd alloy having specific phase structure.
- Electroplating under different conditions of molar ratio of metal ions in the bath demonstrated that Ni content in the deposit increases with Ni content in the bath, favoring normal type codeposition.
- Under no condition of current density (c.d.), the proposed bath having [Ni2+]/ [Cd2+] = 1.5 and 8.0 can exhibit normal type of codeposition at all c.d. studied. i.e., it follows only anomalous type of codeposition.
- Ni-Cd alloy deposited at 4.0 A dm-2 (having ~ 70.77 wt.% Ni) was found to exhibit the least corrosion rate (5.22 × 10⁻² mm y-1), demonstrated by potentiodynamic polarization and EIS study.
- The least CR was attributed to the characteristic surface morphology and phase structure of the coatings, supported by SEM and XRD analysis, respectively.
Acknowledgement
Mr. Vaishaka R.Rao acknowledges National Institute of Technology Karnataka (NITK), Surathkal for financial support in the form of Institute Fellowship.
References
- Gamburg, Y. D. & Zangari, G. ‘Theory and Practice of Metal Electrodeposition.’ Springer Science Publications (2011).
- Ebrahimi, F. & Li, H. ‘Grain growth in electrodeposited nanocrystalline fcc Ni-Fe alloys.’ Scripta Materialia 55, 263-266 (2006).
- Florea, A., Anicai, L., Costovici, S., Golgovici, F. & Visan, T. ‘Ni and Ni alloy coatings electrodeposited from choline chloride-based ionic liquids-electrochemical synthesis and characterization.’ Surface and Interface Analysis 42, 1271-1275 (2010).
- Abdel-Karim, R., Reda, Y., Muhammed, M., El-Raghy, S., Shoeib, M. & Ahmed, H. ‘Electrodeposition and Characterization of Nanocrystalline Ni-Fe Alloys.’ Journal of Nanomaterials 2011, 1-8 (2011).
- Tanaka, K., Sakakibara, M. & Kimachi, H. ‘Grain-size effect on fatigue properties of nanocrystalline nickel thin films made by electrodeposition.’ Procedia Engineering 10, 542-547 (2011).
- Rudnik, E., Wojnicki, M. & Wloch, G. ‘Effect of gluconate addition on the electrodeposition of nickel from acidic baths.’ Surface and Coatings Technology 207, 375-388 (2012).
- You, Y. H., Gu, C. D., Wang, X. L. & Tu, J. P. ‘Electrodeposition of Ni-Co alloys from a deep eutectic solvent.’ Surface and Coatings Technology 206, 3632-3638 (2012).
- Pillai, A. M., Rajendra, A. & Sharma, A. K. ‘Electrodeposited nickel-phosphorous (Ni-P) alloy coating: an in-depth study of its preparation, properties, and structural transitions.’ Journal of Coatings Technology and Research 9, 785–797 (2012).
- Salih, S. A., Mehdi, A. S. & Nouri-Alsaegh, A. S. ‘Study the Effect of Nickel Coating on Fatigue Life of Low Carbon Steel Exposed to Corrosive Environments.’ Journal Environmental Earth Sciences 3, 121-128 (2013).
- Ibrahim, M. A. M., Kooli, F. & Alamri, S. N. ‘Electrodeposition and Characterization of Nickel-TiN Microcomposite Coatings.’ International Journal of Electrochemical Science 8, 12308-12320 (2013).
- Indyka, P., Beltowska-Lehman, E., Tarkowski, L., Bigos, A. & Garcia-Lecina, E. ‘Structure characterization of nanocrystalline Ni-W alloys obtained by electrodeposition.’ Journal of Alloys and Compounds 590, 75-79 (2014).
- Wanga, S., Guoa, X., Yanga, H., Daia, J., Zhua, R., Gonga, J., Penga, L. & Ding, W. ‘Electrodeposition mechanism and characterization of Ni-Cu alloy coatings from a eutectic-based ionic liquid.’ Appllied Surface Science 288, 530-536 (2014).
- Goranova, D., Avdeev, G. & Rashkov, R. ‘Electrodeposition and characterization of Ni-Cu alloys.’ Surface and Coatings Technology 240, 204-210 (2014).
- Budevski, E., Staikov, G. & Lorenz, W.J. ‘Electrochemical Phase Formation and Growth – An Introduction to the Initial Stages of Metal Deposition.’ VCH, Weinheim (1996).
- Paunovic, M. & Schlesinger, M. ‘Fundamentals of Electrochemical Deposition.’ 2nd ed. Wiley-Interscience, New York (1998).
- Fleischmann, M. & Thirsk, H.R. ‘Advances in Electrochemistry and Electrochemical Engineering.’ Vol. 3, P. Delahay (Ed.), Wiley: New York (1963).
- Eliaz, N. & Gileadi, E. ‘Modern aspects of electrochemistry.’ Vol 42. In: Vayenas CG, White RE, Gamboa-Aldeco ME (eds), Springer, New York (2008).
- Popov, K.I., Djokic, S.S. & Grgur, B.N. ‘Fundamental aspects of electrometallurgy.’ Kluwer Academic/Plenum Publishers, New York, (2002).
- Brenner, A. ‘Electrodeposition of Alloys: Principles and Practice.’ Vols. I and II, Academic Press, New York, (1963).
- Rehim, S. S. A. E., Wahaab, S. M. A. E. & Abdella, O. M. ‘Electroplating of nickel-cadmium alloys from alkaline solutions.’ Journal of Chemical Technology and Biotechnology 35A, 217-222 (1985).
- Ganesan, P., Kumaraguru, S. P. & Popov, B. N. ‘Development of Zn–Ni–Cd coatings by pulse electrodeposition process.’ Surface & Coatings Technology 201, 3658-3669 (2006).
- Durairajan, A., Haran, B. S., White, R. E. & Popov, B.N. ‘Development of a New Electrodeposition Process for Plating of Zn-Ni-X (X=Cd, P) Alloys, I. Corrosion Characteristics of Zn-Ni-Cd Ternary Alloys.’ Journal of The Electrochemical Society 147, 1781-1786 (2000).
- Kanani, N. ‘Electroplating: Basic Principles, Processes and PracticeI.’ Elsevier Ltd, Berlin: Germany (2006).
- Jones, D.A. ‘Principles and prevention of corrosion.’ Prentice Hall: New York (1996).
- Fontana, M.G. ‘Corrosion Engineering.’ McGraw Hill (1987).
- Rehim, S. S. A. E., Wahaab, S. M. A-E. & Abdella, O. M. ‘Electrodeposition of Cd-Ni alloys from ammoniacal baths.’ Surface Technology 21, 245-253 (1984).
- Pardhasaradhy, N.V. ‘Practical Electroplating Hand Book.’ Prentice Hall Incl. Pub: New Jersey (1987).
- Nwaogu, U.C., Blawert, C., Scharnagl, N., Dietzel, W. & Kainer, K.U. ‘Effwct of organic acid pickling on the corrosion resistance of magnesium alloy AZ31 sheet.’ Corrosion Science 52, 2143-2154 (2010).
- Yuan, X., Song, C., Wang, H. & Zhang, J. ‘Electrochemical Impedance Spectroscopy in PEM Fuel Cells.’ Springer Publications, London (2010).
PDF Version of the article |
Epub Version of the article |
Flash Version of the article |
| [qr-code size=”2″] | ||