
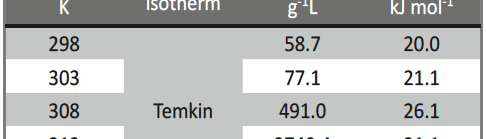
 Tab. 5: Values of adsorption isotherm parameters for CS in 1 M HCl contain different doses of Delonix regia leaf extract
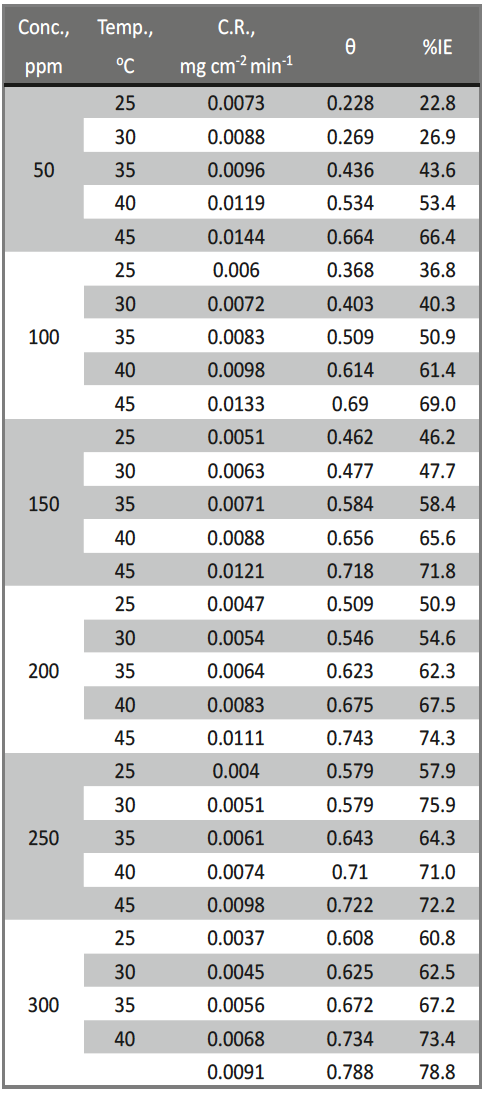
Delonix regia leaf extract activity as a green corrosion inhibitor (environmental friendly) for carbon steel (CS) in 1M HCl has been studied using weight loss (WL), potentiodynamic polarization (PP), electrochemical frequency modulation (EFM) and electrochemical impedance spectroscopy (EIS). The weight loss results show that Delonix regia leaf extract is an excellent corrosion inhibitor. The inhibition efficiency (IE) increases with temperature from 25 to 45oC, reaching a maximum value of 78.8 % at the highest concentration of 300 ppm at the temperature of 45oC. Polarization measurements demonstrate that the Delonix regia leaf extract acts as a mixed type inhibitor. Nyquist plot illustrates that on increasing Delonix regia leaf extract dose, the charge transfer increases and the double layer capacitance decreases. The adsorption of Delonix regia leaf extract on CS obeys Temkin adsorption isotherm.
1. Introduction
Carbon steel is the extended metal used in industrial purpose, equipment, building and more in manufacturing of installations for petroleum, fertilizers and other industry. Protection of CS in aqueous solutions is universal request, conomical, environmental, and aesthetical important [1]. Use of inhibitor is more effective way to reduce corrosion. The organic compounds are widely used as corrosion inhibitors as such as O, N, P, S, and heavy metals. But the organic compounds are hazards and unfriendly environment inhibitors [2]. In spite of the broad spectrum of organic compounds available as corrosion inhibitors, there is increasing concern about the toxicity of most corrosion inhibitors because they are toxic to living organism and may also poison the earth. Organic corrosion inhibitor products are proven as effective, but they tend to be expensive also may be flammable, environmental risks and toxicity (inhalation and skin contact risk). There is accordingly a need for safer and more environmentally friendly corrosion inhibiting products that are also cost effective. These have prompted searches for green corrosion inhibitors. According to Eddy et al [3], green corrosion inhibitors have the advantage of being inexpensive, biodegradable, do not contain heavy metals (non-toxic compounds), and eco-friendly. The successful use of naturally occurring substances to inhibit the corrosion of metals in acidic and alkaline environment has been reported by some research groups [4]. Several researches have been carried out on the inhibition of the corrosion of steel by some plant extracts. The successful use of naturally occurring substances to inhibit the corrosion of metals in both acidic and alkaline environments has been reported by some research groups [5-11] to mention but a few.
This research will discuss the “Delonix regia leafextract” as green corrosion inhibitor which renewable source, friendly environmental acceptance, biodegradable, safer and cheaper than other green corrosion inhibitors for protecting CS in 1 M HCl. Hydrochloric acid is selected for present study, due to its wide industrial applications such as acid pickling, acid cleaning, water cooling and circulation or acid heat exchanger [12].
2. Experimental methods 2.1. Plant extract preparation
Delonix regia leaf was dried in the shade at room temperature and grind using electrical mill into fine powder. One g of powder Delonix regia leaf was dissolved in one liter bidistilled water by heating, cool at room temperature, then filtrate. 10 ml filtrate + 5 ml ethanol were put in condensate-collecting flask of rotary evaporator to determine concentration of dissolved substance in plant extract solution. The remained weight of dry substance in collection flask after evaporation the solvent equal the equivalent weight dissolved 10 ml filtrate. By this we can prepare stock plant extract solution with desired concentration [13].
2.2. Carbon steel samples
Chemical composition of CS was described below:
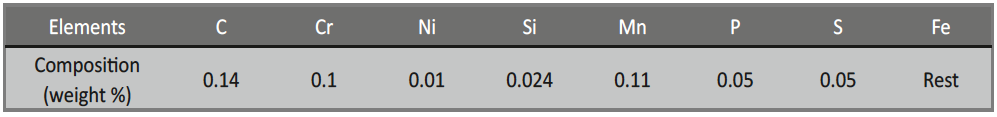
The corrosive media 1 M HCl solution were prepared for each experiment using analytical grade hydrochloric acid (37%) and diluted with bidistilled water. The concentration range of Delonix regia leaf extract inhibitor was 50-300 ppm.
2.3. WL measurements
Similar CS coupons with dimensions (2×2×0.2) cm were abraded with emery paper (grade from 320 to 1200 grit sizes) and then washed with bidistilled water and acetone. After accurate weighting, the coupons were immersed in a beaker which contained 100 ml of HCl with and without addition of different concentrations of Delonix regia Leaf extract. Through period time of 30 min coupons were removed, washed, dried and re-weighted accurately through 3 hours at various temperatures from 25 to 45°C. The average WL of CS coupons could be obtained. %IE and the degree of surface coverage θ of Delonix regia Leaf for the corrosion of CS can be obtained from equation (1).
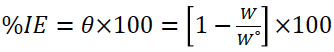
Equation 1
Where Wº and W are the values of the average weight losses without and with addition of the extract, respectively
2.4. Electrochemical measurement
Electrochemical cell with three electrodes was used. The working electrode was CS of surface area of 1 cm2. All potentials were given with reference to the saturated calomel electrode (SCE). The counter electrode was a platinum plate of surface area of 1 cm2. The working electrode was immersed in the test solution for 30 min to reach the open circuit potential (the CS used in the polarization measurements was identical to that used in the WL measurements). Before each experiment, the electrode was abraded using emery papers as before. After this, the electrode was cleaned with ethyl alcohol or acetone and washed by bidistilled water. Tafel polarization curves were determined by polarizing to ± 250 mV with respect to the free corrosion potential (vs. SCE) at a scan rate of 0.5 mV/s. Stern-Geary method used for the determination of corrosion current is performed by extrapolation of anodic and cathodic Tafel lines to a point which gives log icorr and the corresponding corrosion potential (Ecorr) were obtained. Then icorr was used for calculation of % IE and θ as in following equation (2):
Equation 2
Where icorr (free) and icorr (inh) are the corrosion current densities in the absence and presence of inhibitor, respectively. EIS measurements were carried out in frequency range from 0.3 Hz to 100 KHz with amplitude of 5 mV peak to peak using AC signals at open potential. The experimental impedance was analyzed and interpreted based on the equivalent circuit. The main parameters deduced from the analysis of Nyquist diagram are the charge transfer resistance Rct (diameter of high-frequency loop) and the double layer capacity Cdl. The IE and the θ obtained from the EIS measurements are calculated from the following equation:
Equation 3
where Roct and Rct are the charge transfer resistances without and with extract, respectively. Electrochemical frequency modulation (EFM) was carried out using two frequencies 2 and 5 Hz. The base frequency was 0.1 Hz, so the waveform repeats after 1 s. The higher frequency must be at least two times the lower one. The higher frequency must also be sufficiently slow that the charging of the double layer does not contribute to the current response. Often, 10 Hz is a reasonable limit. The Intermodulation spectra contain current responses assigned for harmonical and intermodulation current peaks. The large peaks were used to calculate the corrosion current density (icorr), the Tafel slopes (βa and βc) and the causality factors CF-2, CF-3 [14]. All measurements were carried out using a using Gamry Potentiostat/Galvanostat/ZRA (model PCI4/750) with a Gamry framework system based on ESA400 measurements; computer was used for collecting data. Echem Analyst 6.03 Software was used for plotting, graphing and fitting data.
3. Results and Discussion
3.1. WL measurements
WL of CS was determined at various times interval in the absence and presence of different doses of Delonix regia leaf extract are shown in Fig. 1. The IE % values calculated are listed in Table 1, it is noted that the IE % increases steadily with increasing the concentration of extract and θ were calculated by equation (1). The observed IE of the Delonix regia leaf could be attributed to the adsorption of its components on CS surface forming protective layer, this layer isolates the metal surface from the corrosive medium and hence decreasing the corrosion rate, with increasing efficiency as extract doses increase [15].
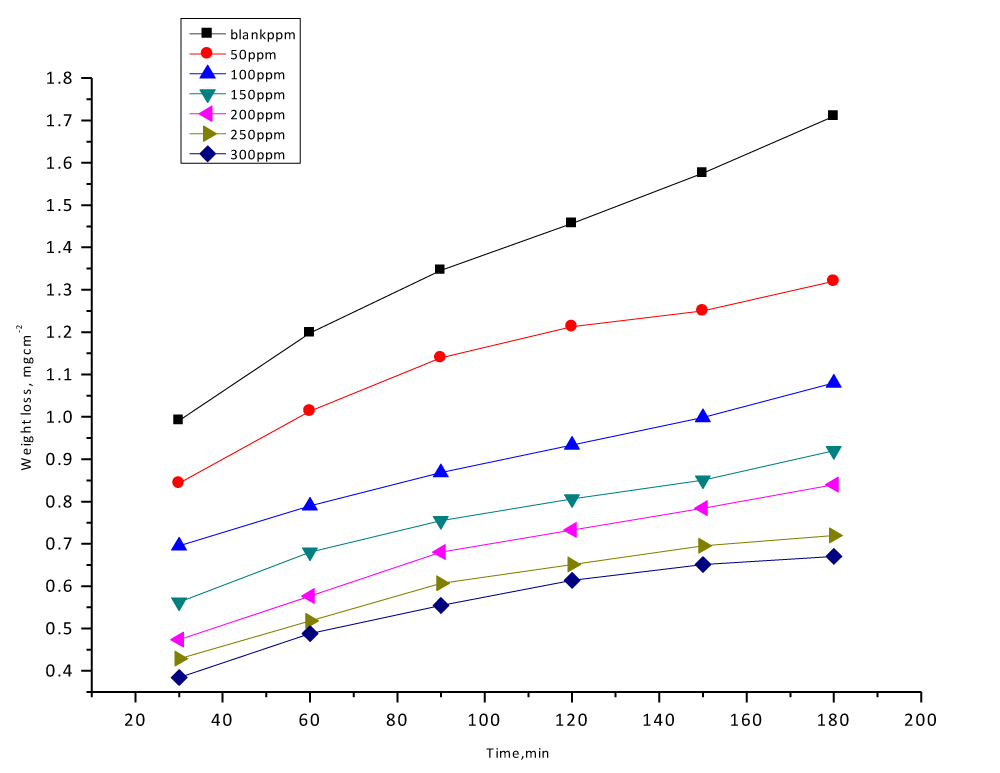
Fig. 1: WL-time curves for the corrosion of CS in 1 M HCl in the absence and presence of different doses of Delonix regia leaf at 25oC
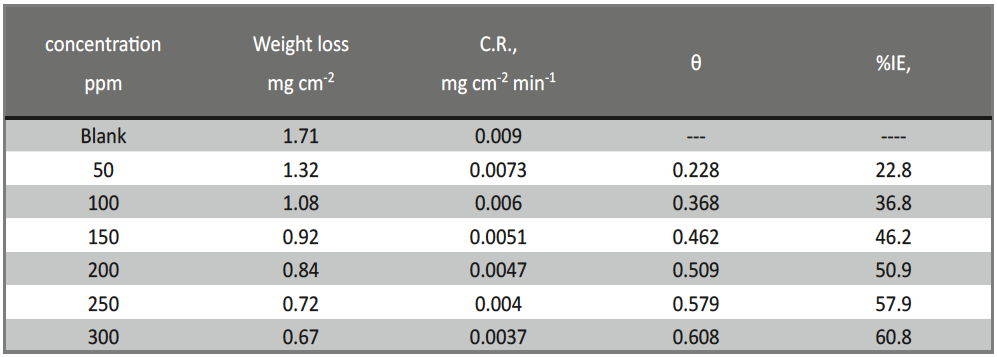
Tab. 1: Corrosion rate (C.R.), surface coverage (θ) and IE obtained from WL measurements for CS in 1 M HCl solutions without and with various doses of Delonix regia leaf extract at 25°C
3.2.1. EIS measurements
The corrosion behavior of CS in 1 M HCl solution in the presence of Delonix regia leaf was investigated by EIS at 25°C after 30 min of immersion. Figure 2 shows the results of EIS experiments in the Nyquist representation.
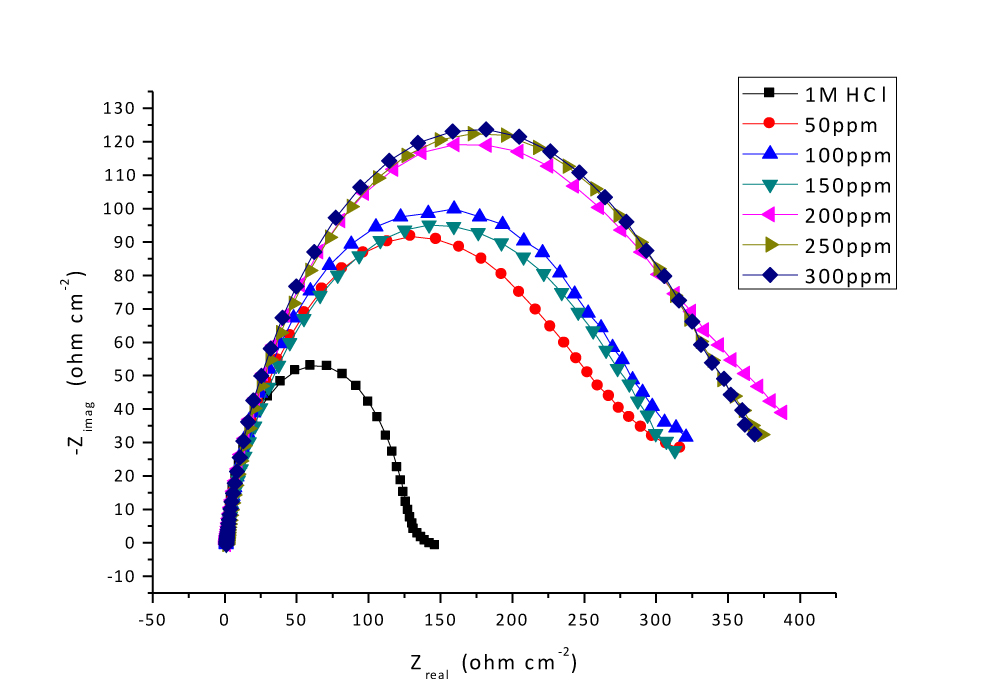
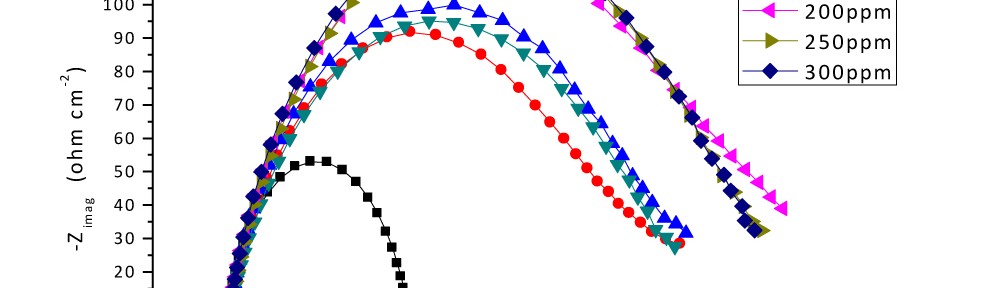
Fig. 2: Nyquist plots for CS in 1M HCl at different doses of Delonix regia leaf at 25°C
It is observed that the curves approximated by a single capacitive semi-circles, showing that the corrosion process was mainly charge transfer controlled [16]. The general shape of the curves is very similar for all samples; the shape is maintained throughout the whole concentrations, indicating that almost no change in the corrosion mechanism occurred due to the inhibitor addition [17].The diameter of Nyquist plots increases on increasing the Delonix regia leaf concentration due to inhibition behavior of Delonix regia leaf extract. The Nyquist plots are analyzed in terms of the equivalent circuit (Figure 3) composed with classic parallel capacitor and resistor.
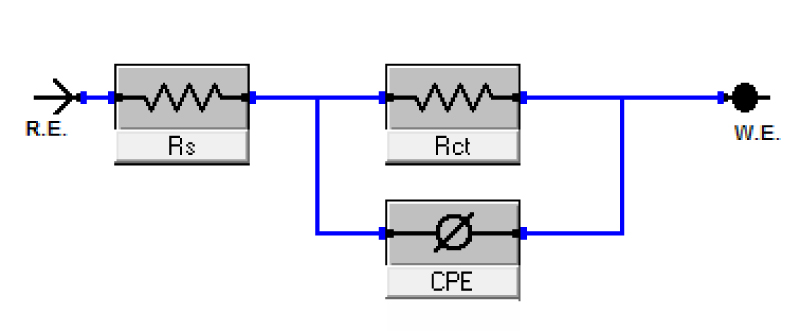
Fig. 3: Electrical equivalent circuit used to fit the EIS data
The impedance of a CPE is described by the Equation 4 [18]:
Equation 4
Where Y0 is the magnitude of the CPE, j is an imaginary number, ω is the angular frequency at which the imaginary component of the impedance reaches its maximum values and n is the deviation of the CPE (-1 ≤ n ≤ 1). The values of the interfacial capacitance Cdl can be calculated from CPE parameter values Y0 and n using Equation 5:
Equation 5
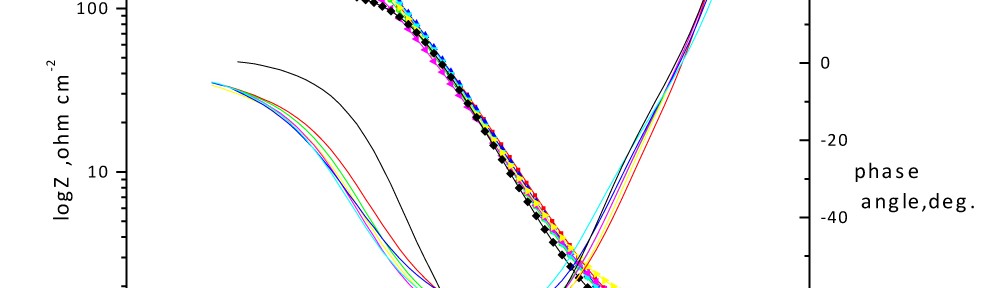
The impedance parameters including the resistance Rct, double layer capacitance Cdl and IE are given in Table 2. Also, Bode plots for the CS in 1 M HCl solution are shown in Figure 4.
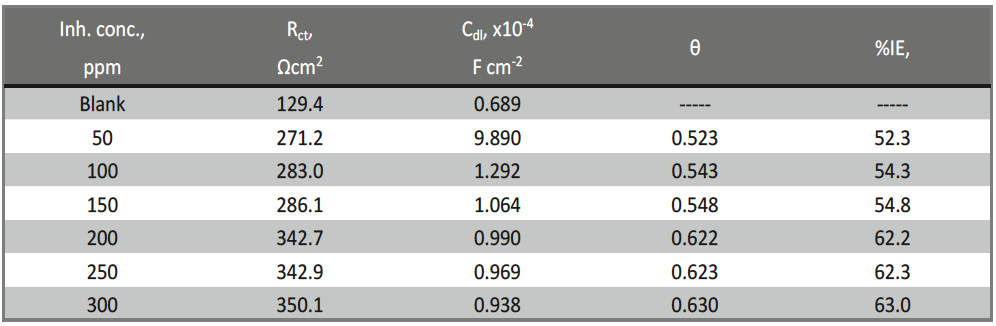
Tab. 2: EIS data of CS in 1 M HCl in the presence of different doses of Delonix regia leaf extract at 25° C
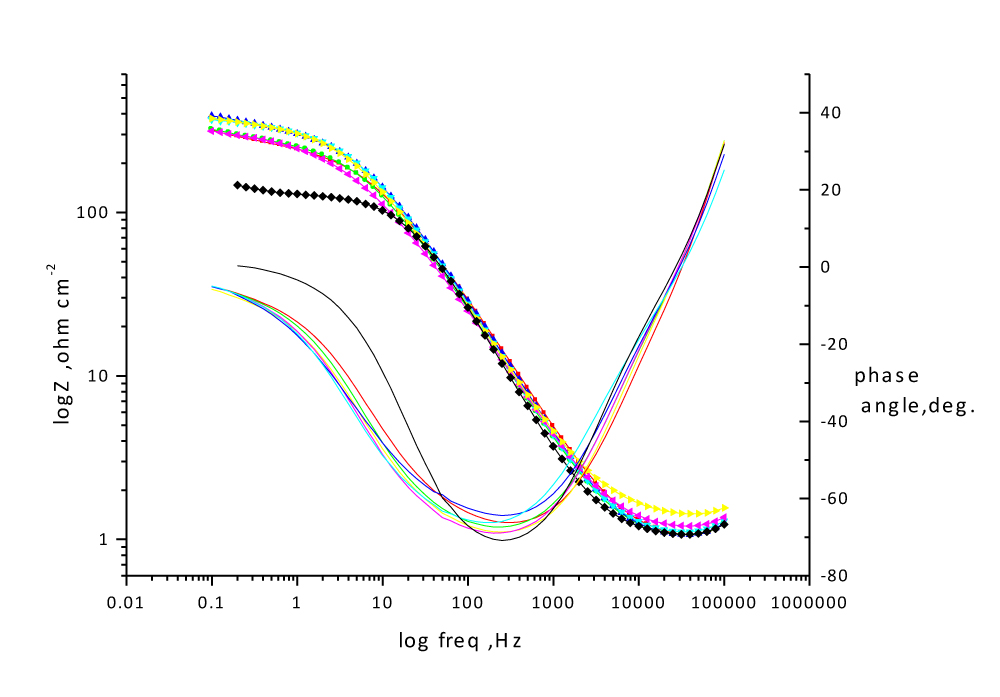
Fig.4: Bode plots for CS in 1M HCl solutions in the absence and presence of various Delonix regia leaf doses at 25oC
In the high frequency limit to the electrolyte resistance represents (ohmic resistance),Rs, while the resistance at low frequency represents the sum of (Rs + Rct), where Rct is in the first approximation determined by both electrolytic conductance of the oxide film and the polarization resistance of the dissolution and repassivation process. The main parameter deduced from the analysis of Nyquist diagram, resistance of charge transfer Rct (diameter of high frequency loop). The capacity of double layer Cdl is defined as:
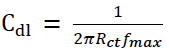
Equation 6
Where fmax is the maximum frequency at which the Zimag of the impedance is a maximum. The inhibition efficiency (IE) can be calculated from Equation 7:
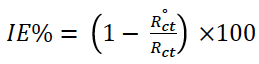
Equation 7
Where Roct and Rct are the charge transfer resistance without and with investigated extract, respectively. With increasing of extract dose Rct value increases, CR decreases, Cdl decreases that indicating a decrease in the local dielectric constant and/or an increase in the thickness of the electrical double layer, suggesting the extract molecules function by the formation of the protective layer at the metal surface. [19, 20].
3.2.2. PP measurements
In presence of Delonix regia leaf extract both anodic and cathodic polarization curves shifted to less current density values due to inhibitive action of extract and with increasing of extract dose the extent of shift increase (Figure 5).

Fig. 5: PP for corrosion of CS in 1 M HCl in the absence and presence of different doses of Delonix regia leaf at 25°C
The values of corrosion current density (icorr), corrosion potential (Ecorr), anodic Tafel constants (βa) and cathodic Tafel constant (βc) from polarization curves are given in Table 3.
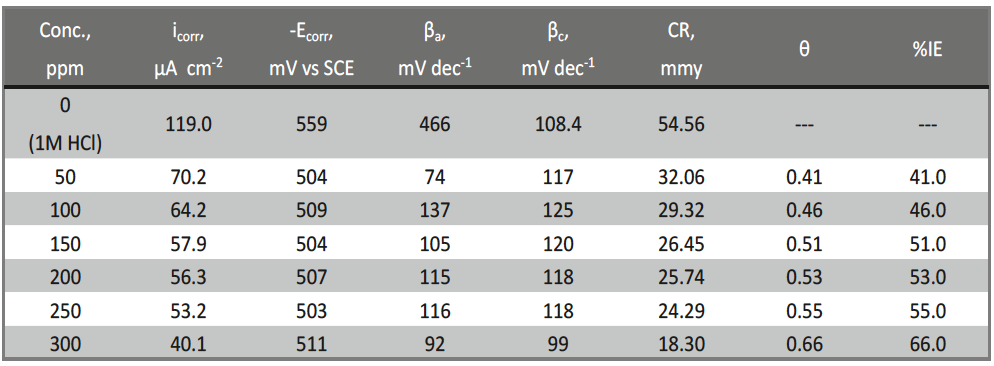
Tab. 3 : PP data of CS in 1 M HCl in the presence of different doses of Delonix regia leaf extract at 25oC
From Table 3, by increasing dose of Delonix regia leaf extract, corrosion potential (Ecorr) is largely shifted to less negative values corrosion current density (icorr) decreased and The % IE increased. Both the anodic and cathodic Tafel constants decrease. these results indicate that the Delonix regia leaf acts as mixed inhibitor [21] .This means that the Delonix regia leaf molecules are adsorbed on both the anodic and cathodic sites resulting in an inhibition of both anodic dissolution and cathodic reduction reactions. The values of %IE obtained by polarization technique are similar to those obtained by WL measurements and EIS.
3.2.3. EFM measurements
Electrochemical frequency modulation (EFM) technique has advantage that is used to determine the corrosion current value without knowledge of Tafel slopes [22]. The great strength of the EFM is the causality factors which serve as an internal check on the validity of EFM measurement. The causality factors CF-2 and CF-3 are calculated from the frequency spectrum of the current responses. The experimental EFM data were treated using two different models: complete diffusion control of the cathodic reaction and the “activation” model. For the latter, a set of three non-linear equations had been solved, assuming that the corrosion potential does not change due to the polarization of the working electrode [23]. The larger peaks were used to calculate the corrosion current density (icorr), the Tafel slopes (βc and βa) and the causality factors (CF-2 and CF-3) as shown in Table 4,
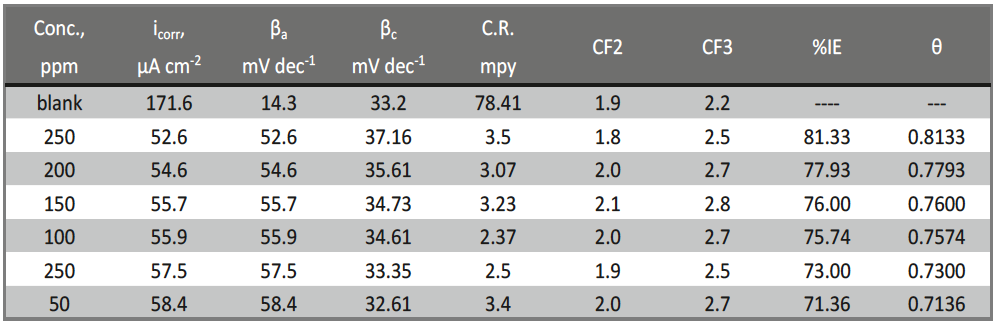
Tab. 4: Electrochemical kinetic parameters obtained by EFM technique for CS in the absence and presence of various doses of the Delonix regia leaf extract in 1 M HCl at 25ºC
indicating that this extract inhibit the corrosion of CS in 1 M HCl through adsorption [24]. By increasing concentration of Delonix regia leaf extract the IEEFM % increase, IEEFM % calculated as follows:
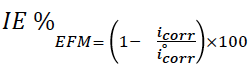
Equation 8
Where iocorr and icorr are C.R. without and with Delonix regia leaf extract, respectively.
3.3.1. Adsorption isotherms
Information on the interaction between inhibitor and metal surface can be provided using the adsorption isotherms [25]. The adsorption of an organic molecules at metal–solution interface can occur as a result of adsorption process between organic molecules present in the aqueous solution (Org) and the water molecules previously adsorbed on the metallic surface (H2O) [26]:
Equation 9
Where Org (sol) and Org (ads) are the organic species in the bulk solution and adsorbed one on the metallic surface, respectively H2O is the water molecule adsorbed on the metallic surface and x is the size ratio representing the number of water molecules replaced by one organic molecule. The surface coverage values (θ) were evaluated using corrosion rate values obtained from the weight loss method. The values for different inhibitor concentrations were tested by fitting to various isotherms. The best fit was obtained with Temkin adsorption isotherm (Fig. 6), given by Equation 10:
Equation 10
Where f is the factor of energetic homogeneity, of the metal surface describing the molecular interactions in the adsorption layer [27]. If f > 0, mutual repulsion of molecules occurs and if f < 0 attraction takes place [28]. From Figure 8 it can be observe that, both the linear correlation coefficient (R2) and the slope of straight line are close to 1, so suggests that the adsorption of Delonix regia leaf on CS surface obeys the Temkin model and exhibit single-layer adsorption characteristic.
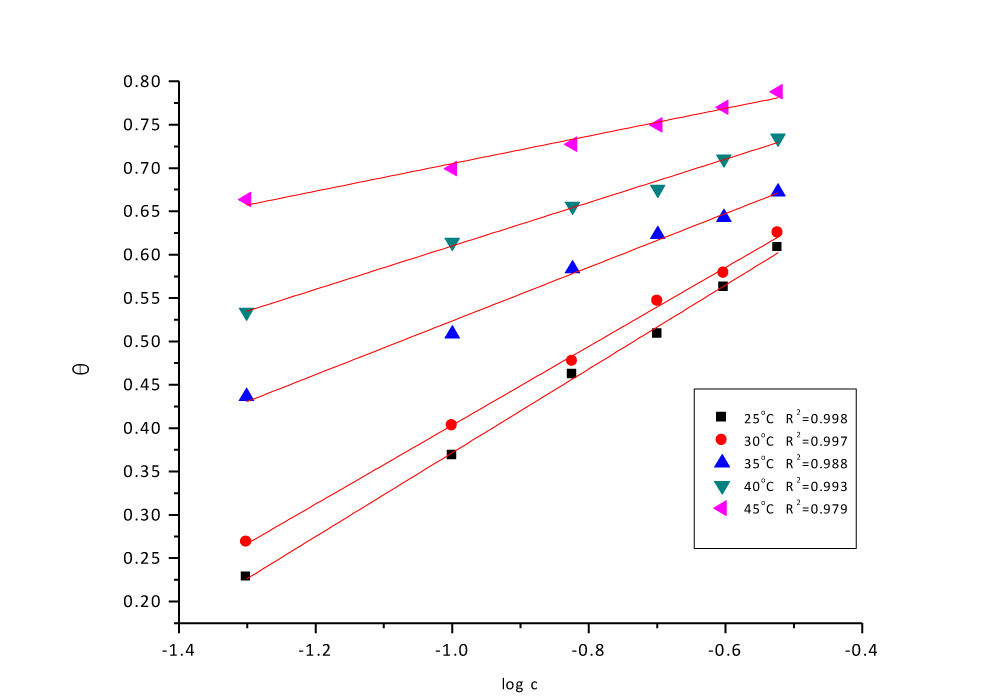
Fig. 6: Temkin adsorption plots for CS in 1 M HCl containing various doses of Delonix regia leaf at 25°C
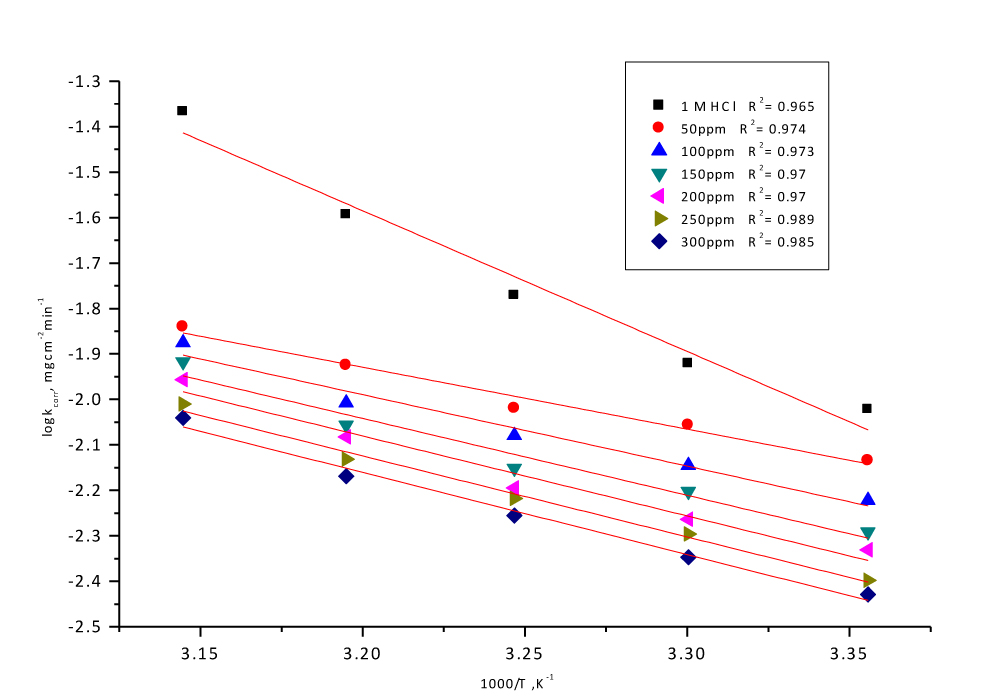
Fig. 7: Arrhenius plots, Log C.R. vs 1/T curves for CS in 1 M HCl in the absence and presence of different doses of Delonix regia leaf extract
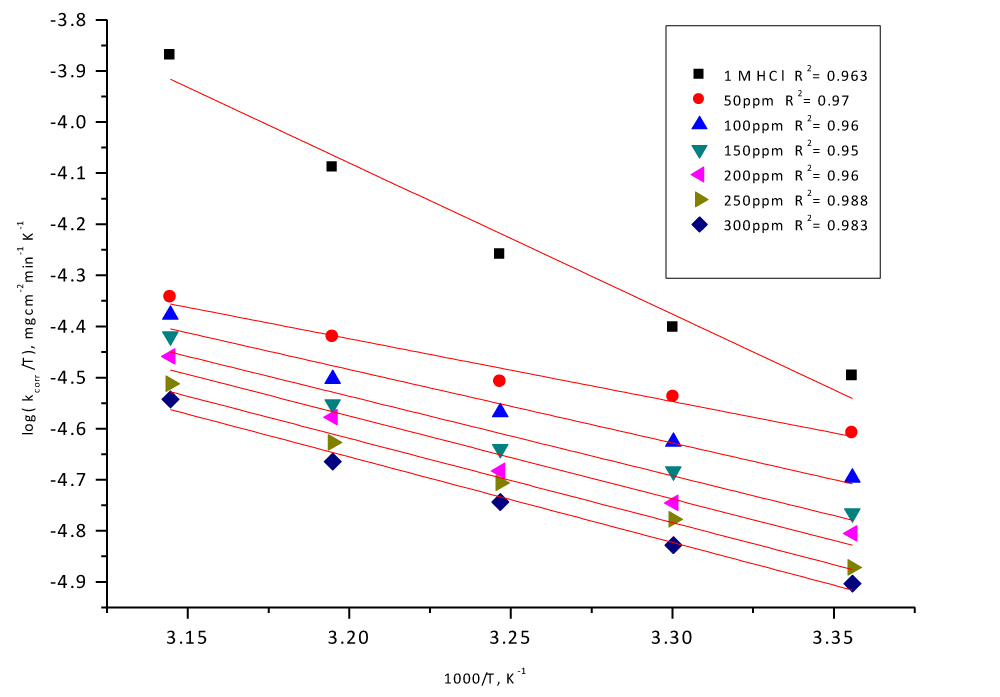
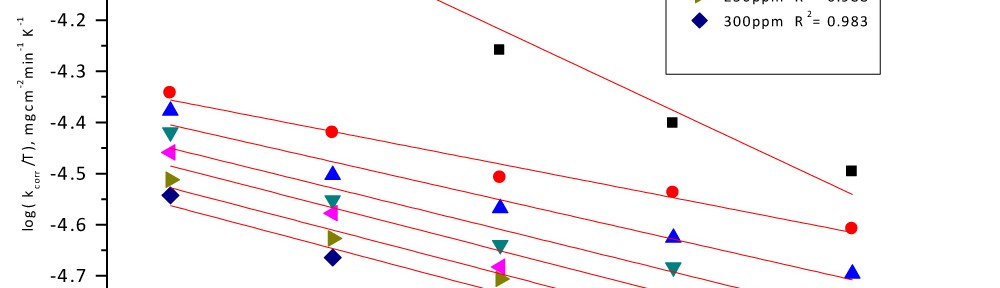
Fig. 8: Transition state plots Log C.R./T vs. 1/T curves for CS in 1 M HCl in the absence and presence of different doses of Delonix regia leaf extract
The equilibrium constant of the adsorption process (Kads) can be calculated from the intercept of the straight line. Relation between Kads and ΔG°ads is given by the following equation [29]:
Equation 11
The value 55.5 is the concentration of water in solution in mol l-1.The calculated ΔG0 ads values, using Equation (11), were also given in Table 5.
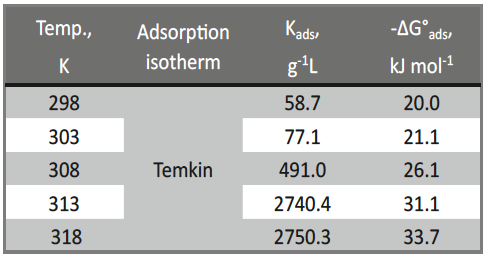
Tab. 5: Values of adsorption isotherm parameters for CS in 1 M HCl contain different doses of Delonix regia leaf extract
Negative values of ΔGo ads indicate that the adsorption process is spontaneous. If the absolute value of ΔG0 ads was of the order of -20 kJ mol-1 or lower, the adsorption process is physisorption and in this process the inhibition occurs by the electrostatic interaction between the organic molecules and iron atom. If the absolute value of ΔGo ads is of the order of -40 kJ mol-1 or higher, the adsorption process is chemisorption and in this process the covalent bond is formed by the charge sharing or transferring from the inhibitor molecules to the metal surface [30, 31]. Calculated ΔGo ads values from Table 6 indicate that the adsorption mechanism of Delonix regia leaf extract on CS in 1 M HCl solution is typically chemisorption and Delonix regia leaf extract is strongly adsorbed on the CS surface.
Tab. 6: Data of WL measurements for CS in 1 M HCl solution in the absence and presence of different doses of Delonix regia leaf extract at different temperatures
3.3.2. Effect of temperature
By using of WL measurements that listed in Table 6, we can study the effect of temperature (range from 25 to 45oC) on the corrosion rate of CS in 1M HCl in absence and presence of different doses of Delonix regia leaf extract. As the temperature and concentration of Delonix regia leaf extract increase, the CR decreases and hence the IE% increases. So the inhibition behavior was observed for chemisorption of extract on metal surfaces. In examining the effect of temperature on the corrosion process in the presence of the Delonix regia leaf, the Arrhenius equation below was used:
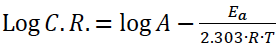
Equation 12
Where C.R. is the corrosion rate, Ea is the apparent activation energy, and A is the frequency factor. Figure 7 represents Arrhenius plot (as log C.R. versus 1/T) for CS corrosion in 1M HCl in the absence and presence of different doses of Delonix regia leaf extract. Straight lines were obtained with slope equals to Ea / 2.303 R. Table 7 contains values of Ea for the corrosion reaction in the absence and presence of Delonix regia leaf extract. Table 8 shows the decrease of activation Energy (Ea) and corrosion rate of CS.
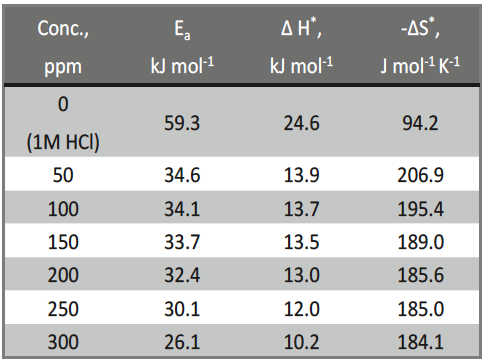
Tab. 7: Activation parameters for corrosion of CS in the absence and presence of different doses of Delonix regia leaf extract in 1 M HCl at different temperatures
The values of Ea of the corrosion process of CS protected by extract are lower than the unprotected CS in 1 M HCl solution. The large decrease in the Ea of the corrosion process in the presence of the extract indicates the higher IE of the extract due to the adsorption of extract molecules on the metal surface to form stable metal-inhibitor complex (M Inh) [32]. The other thermodynamic parameters (ΔS* and Δ H*) were calculated from the linear regression of transition state (Fig. 8) using Equation (13)
Equation 13
Where h is Planck’s constant, N is Avogadro number, ΔS* is the entropy of activation and ΔH* is the enthalpy of activation. A plot of log (C.R./T) vs. 1/T (Fig. 8) should give a straight line, with a slope of (ΔH*/2.303R) and an intercept of [log (R/Nh)+ΔS*/2.303R]. Examination of the kinetic values shows that the increase of inhibitor concentration leads to decrease of all parameters of corrosion process (Table 7). The positive value of the enthalpy ΔH* means that the process is endothermic and it needs more energy to achieve the activated state or equilibrium. The negative value of ΔS* (Table 8) indicates that activated complex in the rate determining step represents an association rather than a dissociation step, meaning that a decrease in disorder takes place during the course of transition from reactant to the activated complex [33].
4. Conclusions
On the basis of this study the following conclusions can be drawn:
- Delonix regia leaf extract acts as corrosion inhibitor for carbon steel in acidic medium.
- The inhibition efficiency of Delonix regia leaf extract increases with increase of the extract concentration and also with temperature.
- Delonix regia leaf was found to obey Temkin adsorption isotherm from the fit of the experimental data at all the doses studied.
- The values of E*a obtained in the presence of the Delonix regia leaf extract were lower compared to the blank acid solution which further support the chemical adsorption proposed.
- The values of ΔGo ads obtained are low and negative, which reveals the spontaneity of the adsorption process
- Also the results indicate that the Delonix regia leaf extract acts as mixed type inhibitor.
References
- N. O. Eddy, Green Chem. 5 (2012) 43.
- K.S. Beenakumari, Green Chem. 4 (2011) 117.
- N.O.Eddy, U.J.Ibok, E.E. Ebenso, J. Appl. Electrochem. 40 (2010)445.
- M.A.Bendahou, M.B.E.Benadellah, B.B. Hammouti, Pig. Resin Technol. 35 (2) (2006) 95.
- A.M.Abdel-Gaber, E.Khamis, H.Abo-Eldahab, S. Adeel, Chem. Phys. 109(2008) 297.
- E.Khamis, A.Hefnawy, A.M. El-Demerdash, Material wissenschaft und Werkstofftechnik, 38 (2007) 227.
- S.A.Umoren, E.E.Ebenso, Pigment Resin Technol. 37 (2008) 173.
- P.C.Okafor, E.E.Ebenso, Pigment Resin Technol. 36 (2007) 134.
- A.Y.El-Etre, Appl. Surf. Sci. 252(2006) 8521.
- S.A Umoren, O.Ogbobe, E.E.Ebenso, U.J.Ekpe, Pigment Resin Technol. 35(2006) 284.
- M.A.Bendahou, M.B.EBenadellah, B.B.Hammouti, Pigment Resin Technol. 35 (2006) 95.
- A.U. Malik, I.N. Andijani, N.A. Siddiqi, S. Ahmed, A.S.Fouda, Technical Report No. SWCCRDC-32 in December, Al-Jubal KSA, 1993.
- M. Ramananda Singh J Mater. Environ. Sci. 4(1) (2013) 119.
- R. G.Parr, R. A.Donnelly, M.Levy, W. E. Palke, Chem. Phys., 68 (1978) 3801.
- R. W.Bosch, J.Hubrecht, W. F.Bogaerts, B. C. Syrett, Corrosion, 57(2001) 60.
- D. Q. Zhang, Q. R.Cai, X. M.He, L. X. Gao, G. S.Kim, Mater. Chem. Phys. 114(2-3) (2009) 612.
- R. Rosliza, W. B.Wan Nik, H. B. Senin, Mater. Chem. Phys., 107 (2008) 281
- F. M. Reisde, H. G. Melo I.Costa, Electrochim. Acta 51 (2006) 1780.
- A. Ostovari, S. M. Hoseinieh, M. Peikari, S. R. Shadizadeh, S.J.Hashemi, Corros.Sci., 51 (2009) 1935.
- M. A. Quraishi, I. H. Farooqi, P. A. Saini, Corrosion, 55 (1999) 493.
- A. M. Abdel-Gaber, B. A. Abd-El-Nabey, M. Saadawy, Corros. Sci., 51 (2009) 1038.
- F. S. de Souza, A. Spinelli, Corros.Sci., 51 (2009) 642.
- E.Kus, F. Mansfeld, Corros. Sci., 48(2006) 965.
- G. A. Caigman, S. K. Metcalf, E. M. Holt, J.Chem. Cryst., 30 (2000) 415.
- S. S. Abdel–Rehim, K. F. Khaled, N. S. Abd–Elshafi, Electrochim. Acta, 51 (2006) 3269.
- M. Ehteshamzadeh, A. H. Jafari, E. Naderi, M. G. Hosseini Mater. Chem. Phys. 113(2-3) (2009) 986
- N. O. Obi-Egbedi, K. E. Essien I. B. Obot, J. Comp. Meth. Mol. Design, 1(2011) 26.
- N. J. N. Nnaji, N.O. Obi-Egbedi J. U. Ani, J. Sci. and Ind. Studies, 9(2011) 26.
- J. Flies, T. Zakroczymski, J. Electrochem. Soc 143(1996) 2458.
- A. Yurt, S. Ulutas, H. Dal, Appl. Surf. Sci., 253(2006) 919.
- F. Hongbo, Synthesis and application of new type inhibitors, Chemical Industry Press, Beijing, 103(2002) 166.
- M. Bouklah, N. Benchat, B. Hammouti, A. Aouniti, S. Kertit, Mater. Lett. 60(2006)1901.
- V. Ramesh Saliyan, A. V. Adhikari, Bull. Mater. Sci., 31(2008) 699.
PDF Version of the article |
Flash Version of the article |
|
| [qrcode] | ||