
 Prof. Dr. A. S. Fouda

Corrosion Inhibition of copper in nitric acid by 8-hydroxy-7-phenylazo-quinoline-5-sulfonicacid derivatives have been studied using weight loss and electrochemical measurements. The results showed that these derivatives act as moderate corrosion inhibitor for copper at all concentrations of these derivatives. All results indicate that the inhibition efficiency increases with increasing inhibitor concentrations. Polarization curves revealed that these derivatives are mixed type inhibitors. The adsorption of these derivatives on the surface of the copper specimens obeys Temkin adsorption isotherm. Some thermodynamic and kinetic parameters for the corrosion process were calculated and discussed. Some quantum chemical parameters for these derivatives calculated by the density function theory (DFT) semi-empirical method to provide further insight into the mechanism of inhibition of the corrosion process.
1. Introduction
Copper metal has been used in integrated circuits for high-speed logic devices because of its excellent electrical and thermal conductivities [1-3]. However, it is well known that copper is very susceptible to corrosion in aqueous media and the corrosion products cause a decrease in the electrical conductivity of the devices [4, 5]. Therefore, the use of inhibitors is one of the important methods used to prevent copper corrosion. Many investigators [6-9] have studied to obtain optimum corrosion protection for copper in various aqueous solutions by either finding new inhibitors or improving the inhibition efficiency [10]. Most acid corrosion inhibitors are nitrogen, sulfur, or oxygen containing organic compounds. Among these compounds, heterocyclic compounds, especially N-based ones, are effective inhibitors for the copper corrosion in aqueous solutions [11]. Especially, imidazole and its derivatives are of interest as corrosion inhibitors for copper metal and alloys [12-15]. Imidazole is a planar, aromatic heterocyclic organic compound with two N atoms forming part of a five membered ring [16]. One of the N atoms is of the pyrrole type and the other is a pyridine-like one. Despite extensive studies undertaken on imidazole, until now, it is still questionable what mechanism is adequate for the explanation of the inhibition of copper corrosion by imidazole in acid solutions.
The objective of this work is to identify four selected 8-hydroxy-7-phenylazo-quinoline-5-sulfonicacid derivatives as corrosion inhibitors for copper in 1M HNO3 by different methods and to analyze the surface morphology of inhibited copper by scanning electron microscope technology with energy dispersive X-ray spectroscopy (SEM-EDX).
2. Experimental procedure
2.1. Composition of material samples
The chemical composition of copper used throughout all investigations was recorded in Table 1.

Tab. 1: Chemical composition of the copper used in this investigation (weight %) is as follows:
2.2. Chemicals and solutions
Nitric acid (70 %BDH grade) was used as corrosive solution. 6 M HNO3 stock solution was prepared by dilution with bidistilled water and its concentration was checked by standardized NaOH solution then 1 M HNO3 was prepared by dilution.
The organic inhibitors used in this study were synthesized in the laboratory as before [17], and are listed in Table (2).
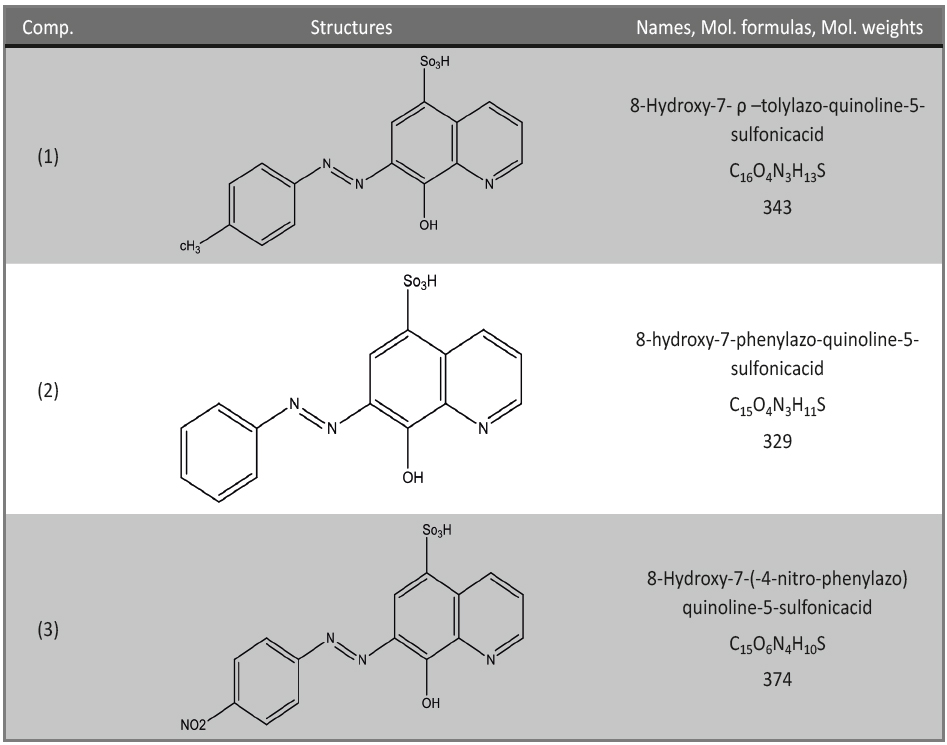
Tab. 2: Chemical structures, names, molecular weights and molecular formulas of 8-hydroxy-7-phenylazo-quinoline-5-sulfonicacid derivatives
2.3 Methods used for corrosion measurements
2.3.1 Weight loss tests
For weight loss measurements, square specimens of size 2 x 2 x 0.2 cm used. The specimens first polished to a mirror finish using 400 up to 1200 grit emery paper, degreased in methanol and finally washed with bidistilled water, dried and weighed. The specimens then immersed into 100 ml of the test solution. The weight loss measurements were conducted in a 100 ml capacity glass beaker placed in water thermostat. The specimens immersed immediately in the test solution without or with desired concentration of the investigated compounds. Triplicate specimens exposed for each condition and the mean weight losses reported in order to verify reproducibility of the experiments. The degree of surface coverage (θ) and inhibition efficiency (% IE) were calculated as follows:
Equation 1:
% IE = θ x 100 = [1-(ΔWinh/ΔWfree)] x 100
Where ΔWfree and ΔWinh are the weight losses in absence and presence of inhibitors, respectively.
2.3.2 Potentiodynamic polarization measurements
All electrochemical measurements were carried out in a conventional three-electrode cell with platinum gauze as the auxiliary electrode and a saturated calomel electrode (SCE) coupled to a fine Luggin capillary as reference electrode. The working electrode was in the form of a square cut from copper sheet of equal composition embedded in epoxy resin of polytetrafluoroethylene so that the flat surface area was 1 cm2. Prior to each measurement, the electrode surface pretreated in the same manner as the weight loss experiments. Before measurements, the electrode immersed in solution at natural potential for 30 mm until a steady state was reached. The potential started from – 600 to + 400 mV vs open circuit potential (Eocp). All experiments carried out in freshly prepared solutions at 30°C and experiments always were repeated at least three times to check the reproducibility.
2.3.3 Electrochemical impedance spectroscopy (EIS) measurements
Impedance measurements were carried out using AC signals of 5 mV peak to peak amplitude at the open circuit potential in the frequency range of 100 kHz to 0.1 Hz. Appropriate equivalent circuit was used to fit all impedance data using Gamry Echem Analyst software.
2.3.4 Electrochemical frequency modulation (EFM) measurements
EFM experiments were carried out by applying potential perturbation signal with amplitude 10 mV with two sine waves of 2 and 5 Hz. The choice for the frequencies of 2 and 5 Hz was based on three arguments [18]. The larger peaks were used to calculate the corrosion current density (icorr), the Tafel slopes (ßc and ßa) and the causality factors CF-2 and CF-3 [19]. All electrochernical experiments were carried out using Gamry instrument PCI300/4 Potentiostat/Galvanostat/Zra analyzer, DC 105 corrosion software, EIS 300 electrochemical impedance spectroscopy software, EFM 140 electrochemical frequency modulation software and Echem Analyst 5.5 for results plotting, graphing, data fitting and calculating.
2.3.5 Surface morphology
The copper surface was prepared by keeping the specimens for 3 days in 1 M HNO3 in the presence and absence of optimum concentration of investigated organic derivatives, after abraded using different emery papers up to 1200 grit size and then polished with Al203 (0.5 m particles size). After this immersion time, the specimens washed gently with bidistilled water, carefully dried and mounted into the spectrometer without any further treatment. The corroded copper surfaces were examined using an X-ray diffractometer Philips (pw-1390) with Cu-tube (Cu Kal, 1= 1.5405 I A0), a scanning electron microscope (SEM, JOEL, JSM-T20, Japan).
2.3.6 Theoretical study
Accelrys (Material Studio Version 4.4) software for quantum chemical calculations has used.
3. RESULTS AND DISCUSSION
3.1. Weight loss measurements
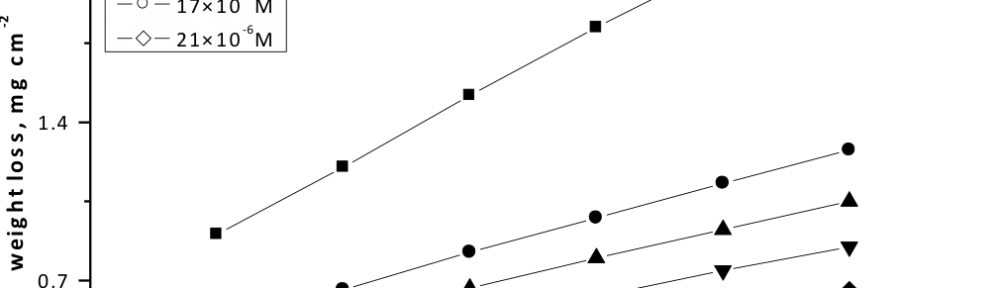
Figure (1) represents the weight loss-time curves for copper in 1 M HNO3 in the absence and presence of different concentrations of compound (1). Similar curves obtained for other inhibitors (not shown). Table (3) collects the values of inhibition efficiency (IE) obtained from weight loss measurements in 1 M HNO3 at 30°C. The results of this Table show that the presence of inhibitors reduces the corrosion rate of copper in 1 M HN03 and hence, increase the inhibition efficiency. The inhibition achieved by these compounds decreases in the following order: Compound (1) > Compound (2) > Compound (3)

Fig. 1: Weight loss-time curves for the dissolution of copper in the absence and presence of different concentrations of compound (1) at 300 0C
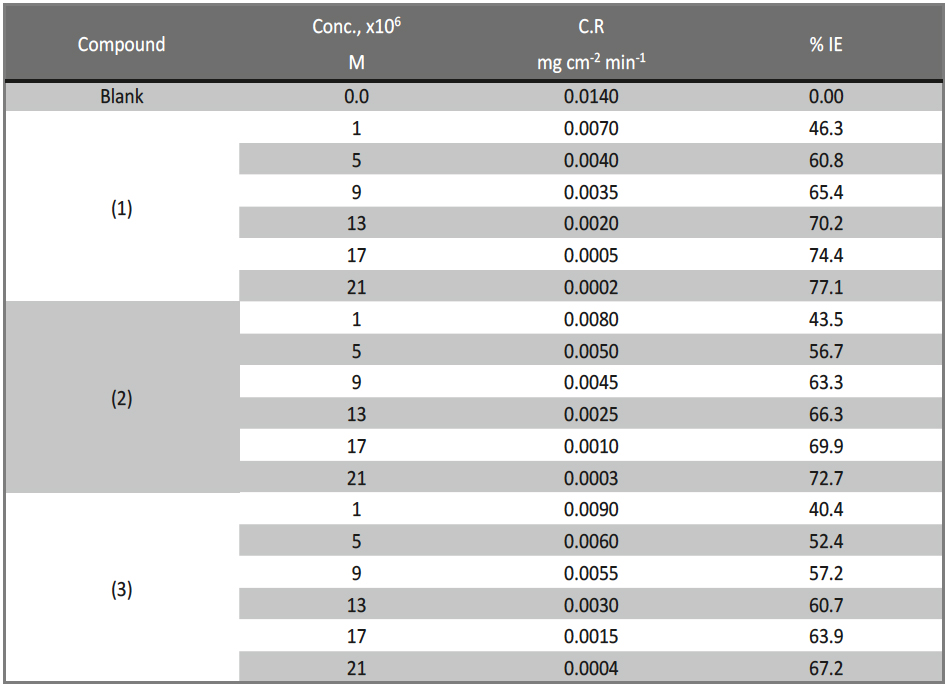
Tab. 3: Inhibition efficiency (% IE) of different compounds with their concentrations at 300 C from wight loss measurement at 120/min immersion in 1M HNO3
3.2. Adsorption isotherms
It is widely acknowledge that adsorption isotherm provide useful insight onto the mechanism of corrosion inhibition as well as the interaction among the adsorbed molecules themselves and their interaction with the electrode surface [20]. In this study, Temkin adsorption isotherm found to be suitable for the experimental results (R2 ˃ 0.98). Temkin adsorption isotherm is:
Equation 2:
θ =2.303/a log Kads + 2.303/a log C
where C is the inhibitor concentration, Kads is the adsorption equilibrium constant. The plot of θ versus log C gives linear relation (Figure 2). The adsorption equilibrium constant Kads, can be calculated from the intercept and ΔG0ads can be calculated from the following equation:
Equation 3:
log Kads= -log55.5 – ΔG°ads/2.303RT
where value of 55.5 is the concentration of water in solution in mole/liter [21], R is the universal gas constant and T is the absolute temperature. It noticed that the value of ΔG°ads, has a negative sign ensure the spontaneity of the adsorption and stability of the adsorbed layer on the alloy surface [22] (Table 4). Values of Kads and ΔGºads for investigated compounds were calculated and recorded in Table 4. The negative values of ΔGºads indicate that these derivatives adsorbed spontaneously on copper surface. Kads were found to run parallel to the % IE [K (1) > K (2) < K (3)]. This result reflects the increasing capability, due to structural formation, on the metal surface [23]. ΔGºads values are less than -20 kJ mol-1 this indication for the physical adsorption.
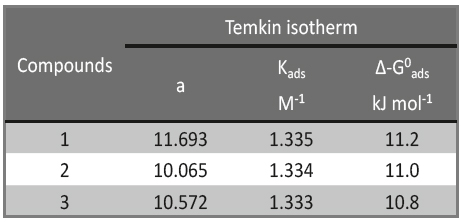
Tab. 4: Inhibitor binding constant (Kads), free energy of binding (ΔGºads) and later interaction parameter (a) for compounds at 30°C
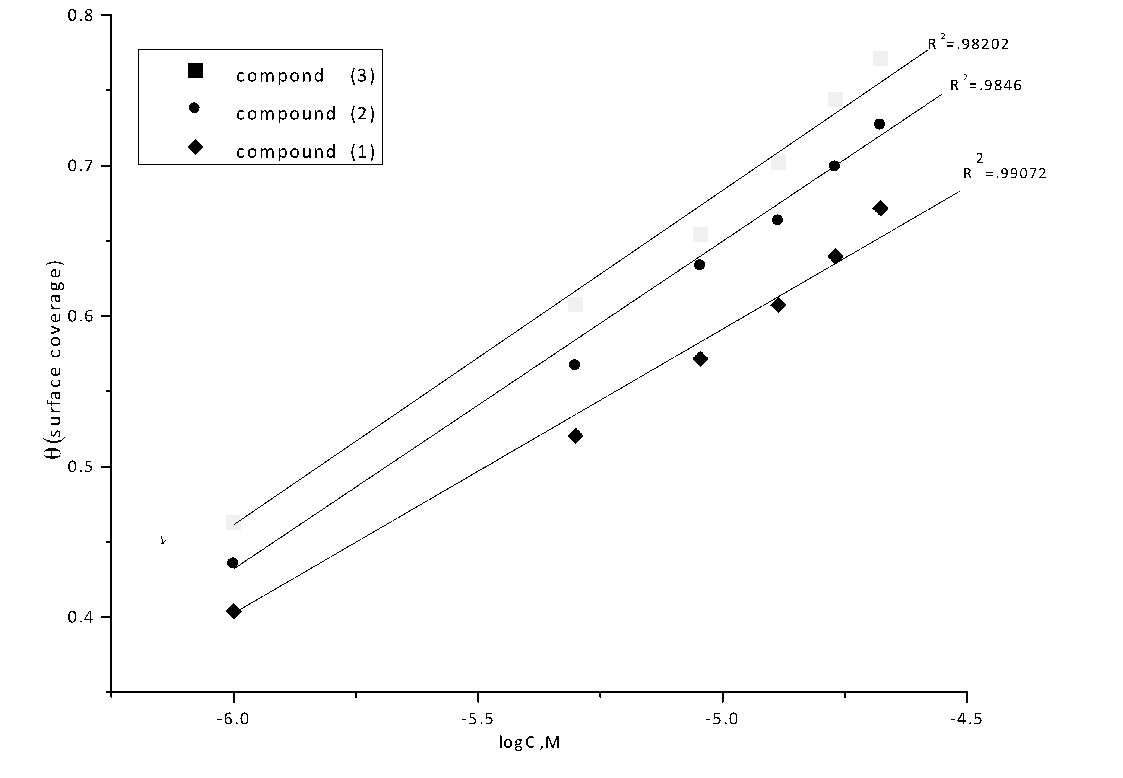
Fig. 2: Curve fitting of corrosion data for copper in 1 M HNO3 in presence of different concentrations of investigated compounds to the Temkin isotherm at 30°C
3.3. Effect of Temperature
The effect of temperature on the inhibited acid-metal reaction is highly complex, because many changes occur on the metal surface, such as rapid etching and desorption of the inhibitor and the inhibitor itself, in some cases, may undergo decomposition and/or rearrangement. Generally, the corrosion rate increases with the rise of temperature and hence the % IE decreases with increasing temperature and increases with increasing the concentration of the inhibitor. The activation energy (E*a) of the corrosion, process was calculated using Arrhenius equation [24]:
Equation 4:
C.R. = A exp (E*a / RT)
where C.R. corrosion rate and A is Arrhenius constant. The values of activation energies E*a can be obtained from the slope of the straight lines of plotting log C.R. vs. 1/T in the presence and absence of investigated compounds at various temperatures as shown in Figure (3) and in Table (5). The values of activation energy increase in the presence of inhibitors and with increase of the concentration of the inhibitors. This is due to the formation of a film of inhibitors on copper surface. The activation energy for the corrosion of copper in 1 M HNO3 was found to be 51.9 kJ mol-1 which is in good agreement with the work carried out by Fouda et al [25] and others [26-27] An alternative formulation of the Arrhenius equation is the transition state equation 5 [28]:
Equation 5:
C.R= RT/Nh exp (Δs*/R) exp (-Δ H*/RT)
where h is Planck’s constant, N is Avogadro’s number, ΔS* is the entropy of activation and ΔH* is the enthalpy of activation. Figure (4) shows a plot of log (C.R. / T) vs. (1/T). Straight lines are obtained with a slope of (Δ H*/2.303 R) and an intercept of (log R/Nh + ΔS*/2.303R) from which the values of ΔH* and ΔS* are calculated and listed in Table (5). From the results of Table (5) it is clear that the positive values of ΔH* reflect that the process of adsorption of the inhibitors on the copper surface is an endothermic process; it is attributable unequivocally to chemisorption [29]. Typically, the enthalpy of a chemisorption process less than 100 kJ mol-1. More interesting behavior was observed that positive ΔS* values is accompanied with endothermic adsorption process. This is agrees with what expected, when the adsorption is an endothermic process, it must be accompanied by an increase in the entropy change and vice versa [30].
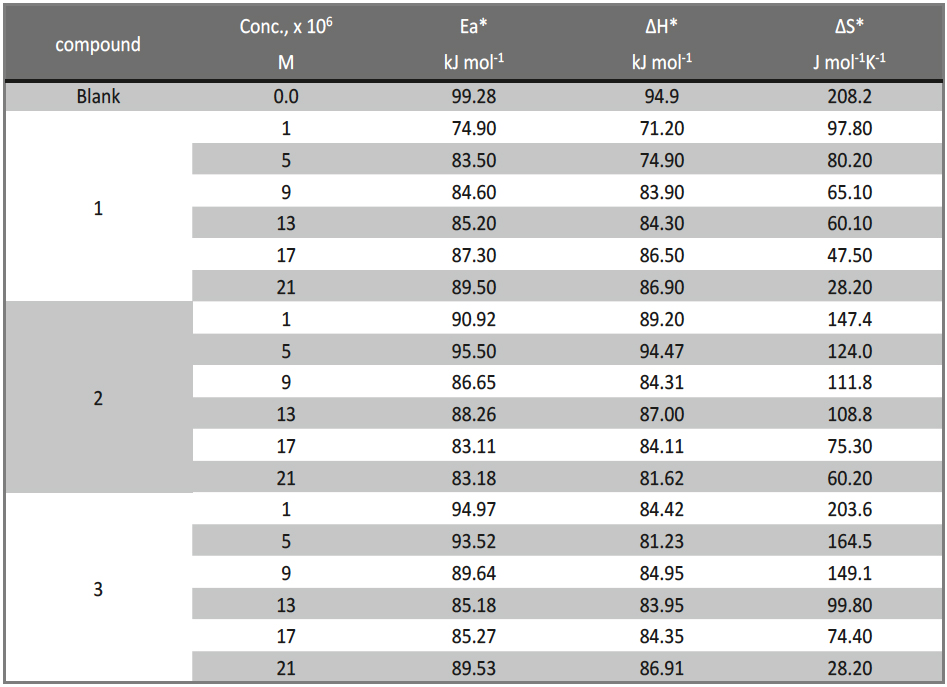
Tab. 5: Thermodynamic activation parameter for the dissolution of copper in 1M HNO3 in the absence and presence of different concentrations of investigated compounds.
It is seen that investigated derivatives have inhibiting properties at all the studied temperatures and the values of % IE decrease with temperature increase. This shows that the inhibitor has experienced a significant decrease in its protective properties with increase in temperature. This decrease in the protective properties of the inhibitor with increase in temperature may be connected with two effects; a certain drawing of the adsorption-desorption equilibrium towards desorption (meaning that the strength of adsorption process decreases at higher temperatures) and roughening of the metal surface which results from enhanced corrosion. These results suggest that physical adsorption may be the type of adsorption of the inhibitor on the copper surface.
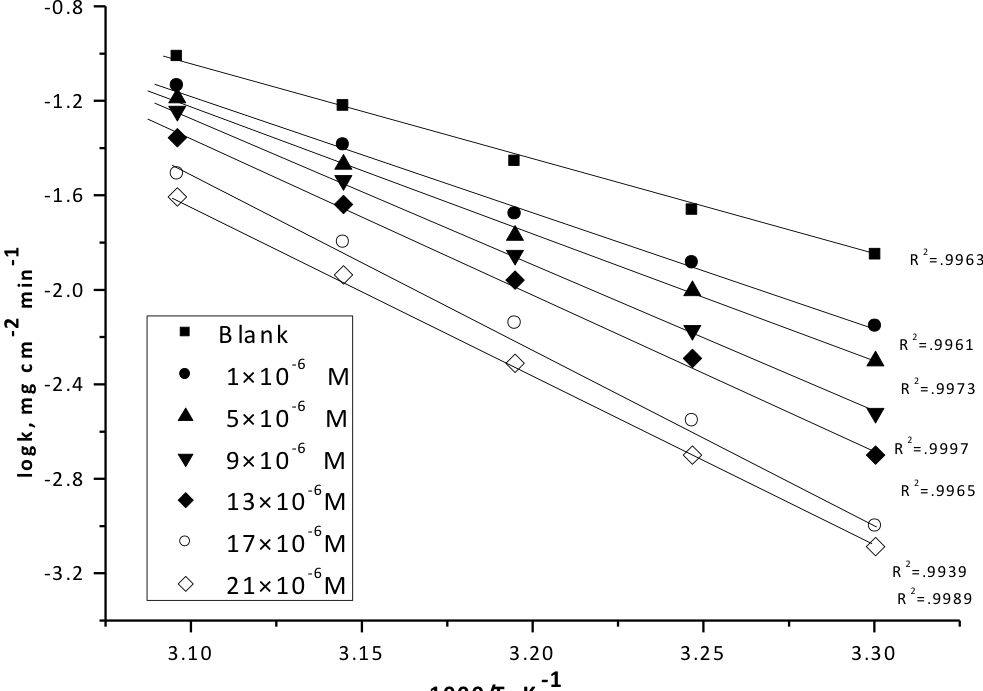
Fig. 3: Log k (corrosion rate) – l/T curves for copper dissolution in 1M HNO3 in absence and presence of different concentrations of compound (1)
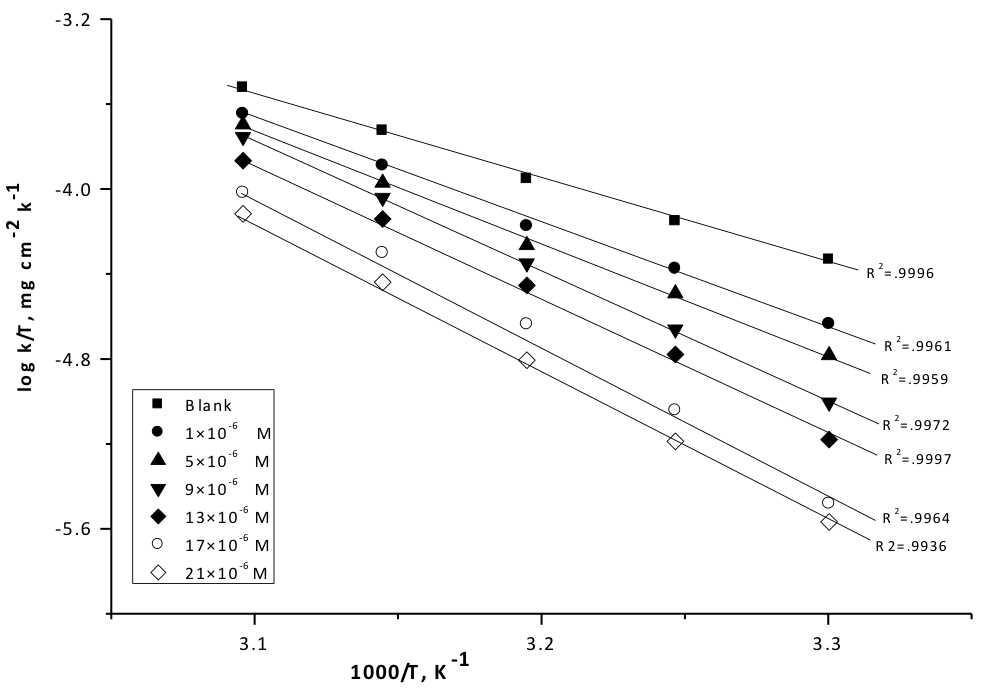
Fig. 4: Log (corrosion rate/T) – (l/T) curves for copper dissolution in 1M HNO3 in the absence and presence of different concentrations of compound (1)
3.4. Potentiodynamic Polarization Measurements
Theoretically, copper can hardly be corroded in the deoxygenated acid solutions, as copper cannot displace hydrogen from acid solutions according to the theories of chemical thermodynamics [31-33]. However, this situation will change in nitric acid. Dissolved oxygen may reduce on copper surface and this will allow corrosion to occur. It is a good approximation to ignore the hydrogen evolution reaction and only consider oxygen reduction in the nitric acid solutions at potentials near the corrosion potentials [34]. Polarization measurements were carried out in order to gain knowledge concerning the kinetics of the cathodic and anodic reactions. Figure (5) shows the polarization behavior of copper electrode in 1 M HNO3 in the absence and presence of various concentrations of compound (1). Figure (5) shows that both the anodic and cathodic reactions are affected by the addition of investigated derivatives and the inhibition efficiency increases as the inhibitor concentration increases, meaning that the addition of inhibitors reduces the anodic dissolution of copper and also retards the cathodic reactions. Therefore, investigated derivatives considered as mixed type inhibitors. The values of electrochemical parameters such as corrosion current densities (icorr). corrosion potential (Ecorr), the cathodic Tafel slope (ßc), anodic Tafel slope (ßa) and inhibition efficiency (% IE) were calculated from the curves of Figure 5 and are listed in Table (6). The results in Table (6) revealed that the corrosion current density decreases obviously after the addition of inhibitors in 1 M HNO3 and %IE increases with increasing the inhibitor concentration. In the presence of inhibitors, Ecorr was enhanced with no definite trend, indicating that these compounds act as mixed type inhibitors. The inhibition efficiency and the degree of surface coverage (ɵ) were calculated using equation 6.
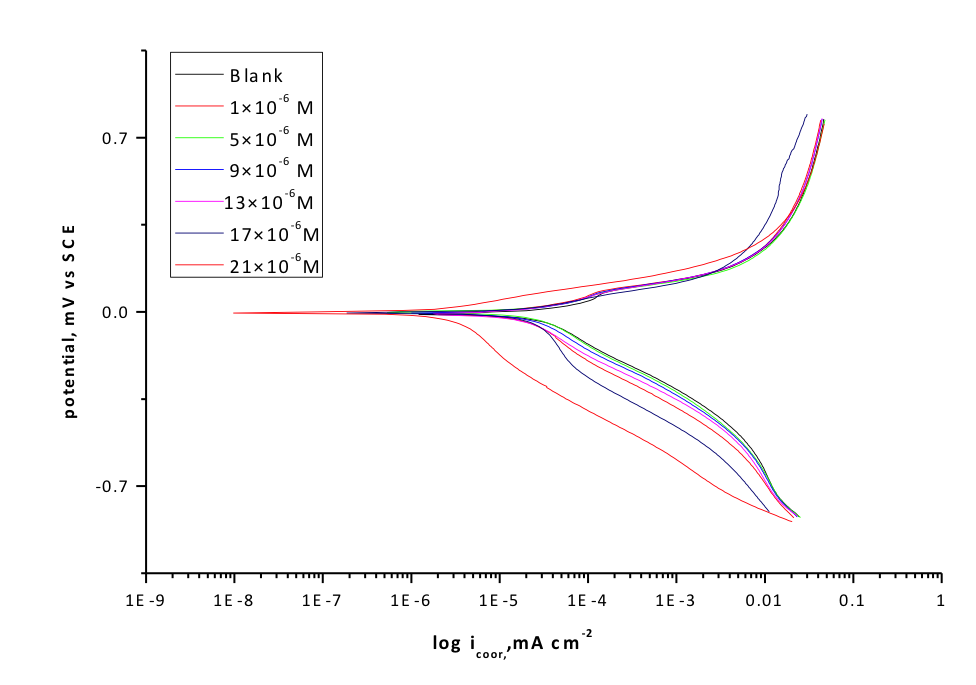
Fig. 5: Potentiodynamic polarization curves for the corrosion of copper in 1 M HNO3 in the absence and presence of various concentrations of compound (1) at 30°C
Equation 6:
% IEp= θ x100 = [(i°corr– icorr)/ i°corr] x 100
where i0corr and icorr are the uninhibited and inhibited corrosion current densities, respectively.
Also it is obvious from Table (6) that the slopes of the anodic (ßa) and cathodic (ßc) Tafel lines remain almost unchanged upon addition of tested derivatives, giving rise to a nearly parallel set of anodic lines, and almost parallel cathodic plots results too. Thus the adsorbed inhibitors act by simple blocking of the active sites for both anodic and cathodic processes. In other words, the adsorbed inhibitors decrease the surface area for corrosion without affecting the corrosion mechanism of copper in 1 M HNO3 solution, and only causes inactivation of a part of the surface with respect to the corrosive medium [35, 36]. The inhibition efficiency of these compounds follows the sequence: Compound (1) > compound (2) > compound (3). This sequence may attribute to free electron pair in oxygen atom, electrons on aromatic nuclei and the substituent in the molecular structure of the inhibitor, and again reflects, as confirmed from weight loss measurements, the increased ability of compound (1) to inhibit corrosion of copper in HNO3 as compared to compound (3).
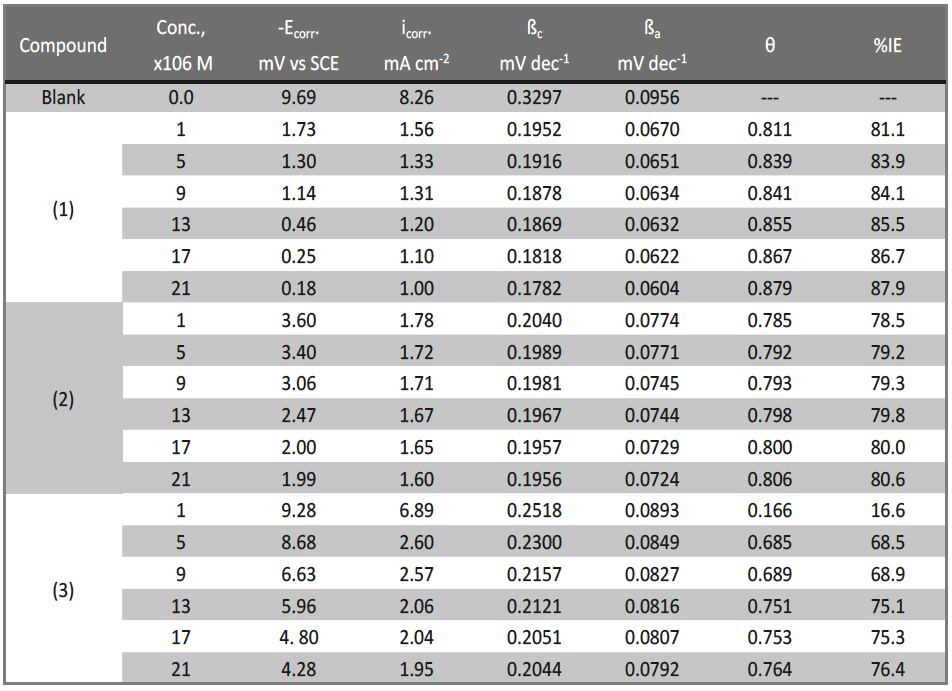
Tab. 6: Effect of concentrations of the investigated compounds on the free corrosion potential (Ecorr.), corrosion current density (icorr), Tafel slopes (ßa&ßc) degree of surface coverage (θ) and inhibition efficiency (% IE) for copper in 1M HNO3 at 30°C
3.5 Electrochemical Impedance Spectroscopy (EIS) Measurements
EIS is well-established and powerful technique in the study of corrosion. Surface properties, electrode kinetics and mechanistic information can be obtained from impedance diagrams [37-41]. Figure (6) shows the Nyquist (a) and Bode (b) plots obtained at open-circuit potential both in the absence and in presence of increasing concentration of investigated compounds at 30°C. The increase in the size of the capacitive loop with the addition of organic derivatives shows that a barrier gradually forms on the copper surface. The increase in the capacitive loop size (Fig. 6a) enhances, at a fixed inhibitor concentration, following the order: compound (I) > compound (2) compound (3), confirming the highest inhibitive influence of compound (1). Bode plots (Figure 6b), shows that the total impedance increases with increasing inhibitor concentration (log Z vs. log f). However (log f vs. phase), also Bode plot shows the continuous increase in the phase angle shift, obviously correlating with the increase of inhibitor adsorbed on copper surface. The Nyquist plots do not yield perfect semicircles as expected from the theory of EIS. The deviation from ideal semicircle was generally attributed to the frequency dispersion [42] as well as to the inhornogeneities of the surface. EIS spectra of the tested additives were analyzed using the equivalent circuit, Figure (7), which represents a single charge transfer reaction and fits well with our experimental results. The constant phase element, CPE, is introduced in the circuit instead of a pure double layer capacitor to give a more accurate fit [43]. The double layer capacitance Cdl, can be calculated using equation 7.
Equation 7:
Cdl = Yo ɷn-1 / sin [n (π/2)]
where Y0 is the magnitude of the CPE, ɷ = 2πfmax, fmax is the frequency at which the imaginary component of the impedance is maximal and the factor n is an adjustable parameter that usually lies between 0.5 and 1.0. After analyzing the shape of the Nyquist plots, it is concluded that the curves approximated by a single capacitive semicircles, showing that the corrosion process was mainly charged-transfer controlled [45, 46]. The general shape of the curves is very similar for all samples (in presence or absence of inhibitors at different immersion times) indicating that no change in the corrosion mechanism [47]. From the impedance data (Table 7), we conclude that the value of % IE increases with increasing the concentration of the inhibitor. In fact, the presence of inhibitor enhances the value of Rct in acidic solution. Values of double layer capacitance decrease by adding inhibitors and the decrease in the values of CPE follows the order similar to that obtained for icorr in this study. The decrease in CPE/Cdl results from a decrease in local dielectric constant and/or an increase in the thickness of the double layer, suggesting that organic derivatives inhibit the iron corrosion by adsorption at metal/acid [48, 49]. The inhibition efficiency calculated from equation 8 [50]:
Equation 8:
%IEEIS = [1 – (R°ct / Rct)] x 100
where R°ct and Rct are the charge-transfer resistance values without and with inhibitor respectively.
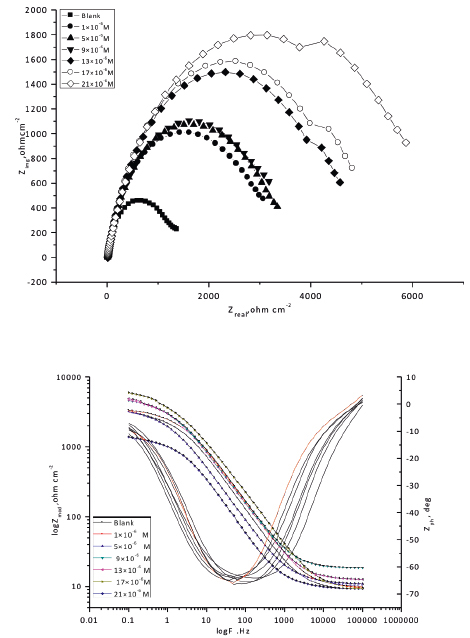
Fig. 6. The Nyquist (a) and Bode (b) plots for corrosion of copper in 1 M HNO3 in the absence and presence of different concentrations of compound (1) at 30°C
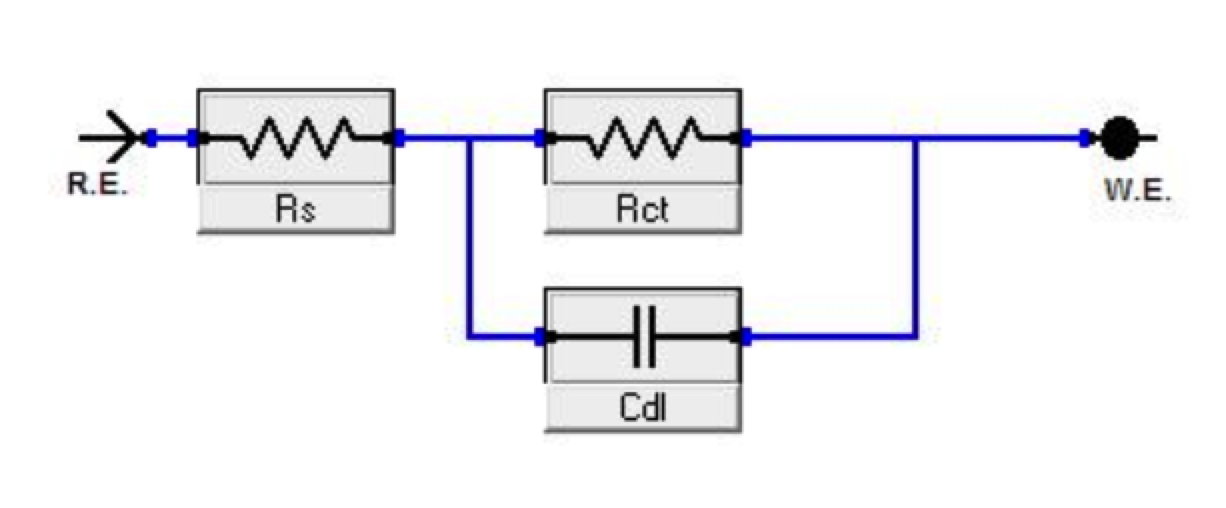
Fig. 7: Equivalent circuit model used to fit experimental EIS Where R is a resistor (Rs is solution resistance and Rct is charge transfer resistance), and Cdl represents the double layer capacitance.
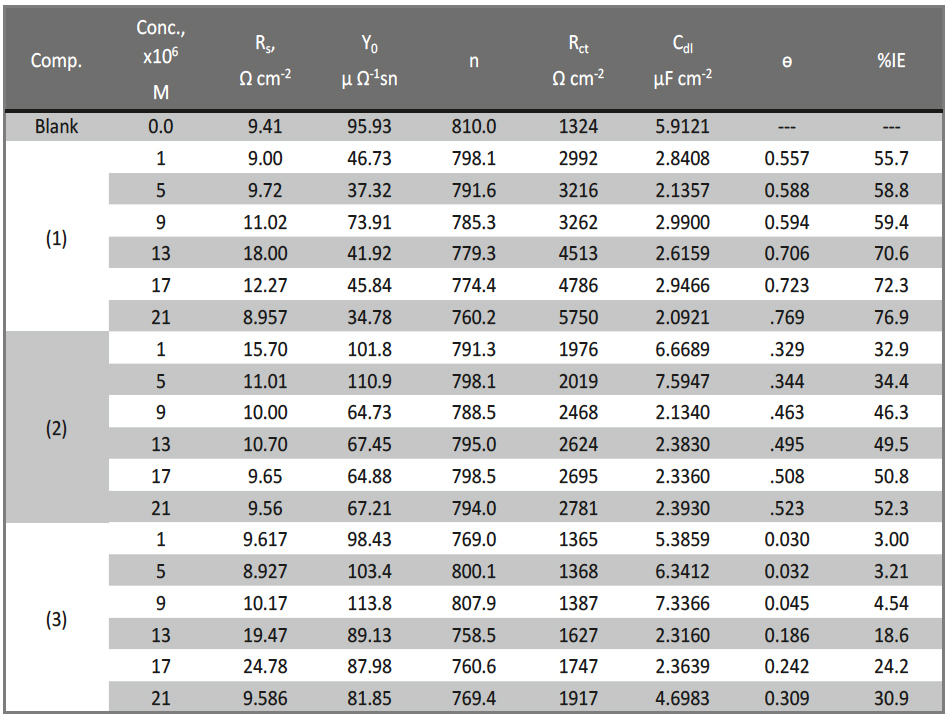
Tab. 7: Electrochemical kinetic parameters obtained by ETS technique for copper in1 M HNO3 without and with various concentrations of investigated compounds at 30°C
3.6. Electrochemical Frequency Modulation Technique (EFM)
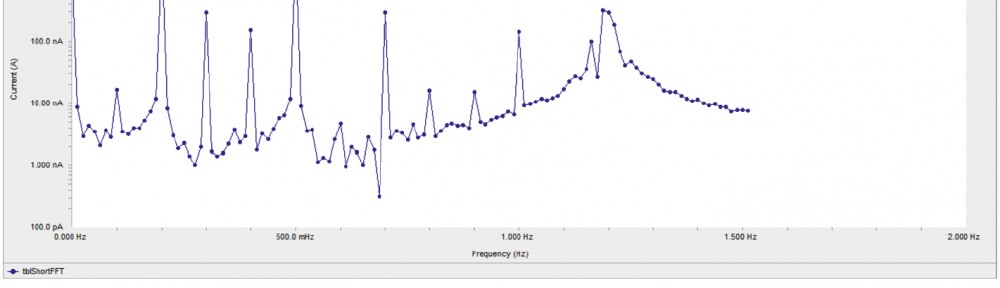
EFM is a nondestructive corrosion measurement technique that can be quickly determine the corrosion current values without prior knowledge of Tafel slopes, and with only a small polarizing signal. These advantages of EFM technique make it an ideal candidate for online corrosion monitoring [51]. The great strength of the EFM is the causality factors, which serve as an internal check on the validity of EFM measurement. The causality factors CF-2 and CF-3 are calculated from the frequency spectrum of the current responses. Figure (8) shows the EFM Intermodulation spectrums of copper in nitric acid solution containing 21×10-6M compound (1). Similar curves obtained for other compounds (not shown). The experimental EFM data were treated using two different models: complete diffusion control of the cathodic reaction and the “activation” model. For the latter, a set of three non-linear equations had solved, assuming that the corrosion potential does not change due to the polarization of the working electrode [52]. The larger peaks used to calculate the corrosion current density (icorr), the Tafel slopes and 3a) and the causality factors (CF-2 and CF-3). These electrochemical parameters listed in Table (8). The data presented in Table (8) obviously show that, the addition of any one of tested compounds at a given concentration to the acidic solution decreases the corrosion current density, indicating that these compounds inhibit the corrosion of copper in 1 M HNO3 through adsorption. The causality factors obtained under different experimental conditions are approximately equal to the theoretical values (2 and 3) indicating that the measured data are verified and of good quality. The inhibition efficiencies %IEEFM increase by increasing the inhibitor concentrations and was calculated as from equation 6. The inhibition efficiency obtained from this method is in the order: compound (1) > compound (2) > compound (3).
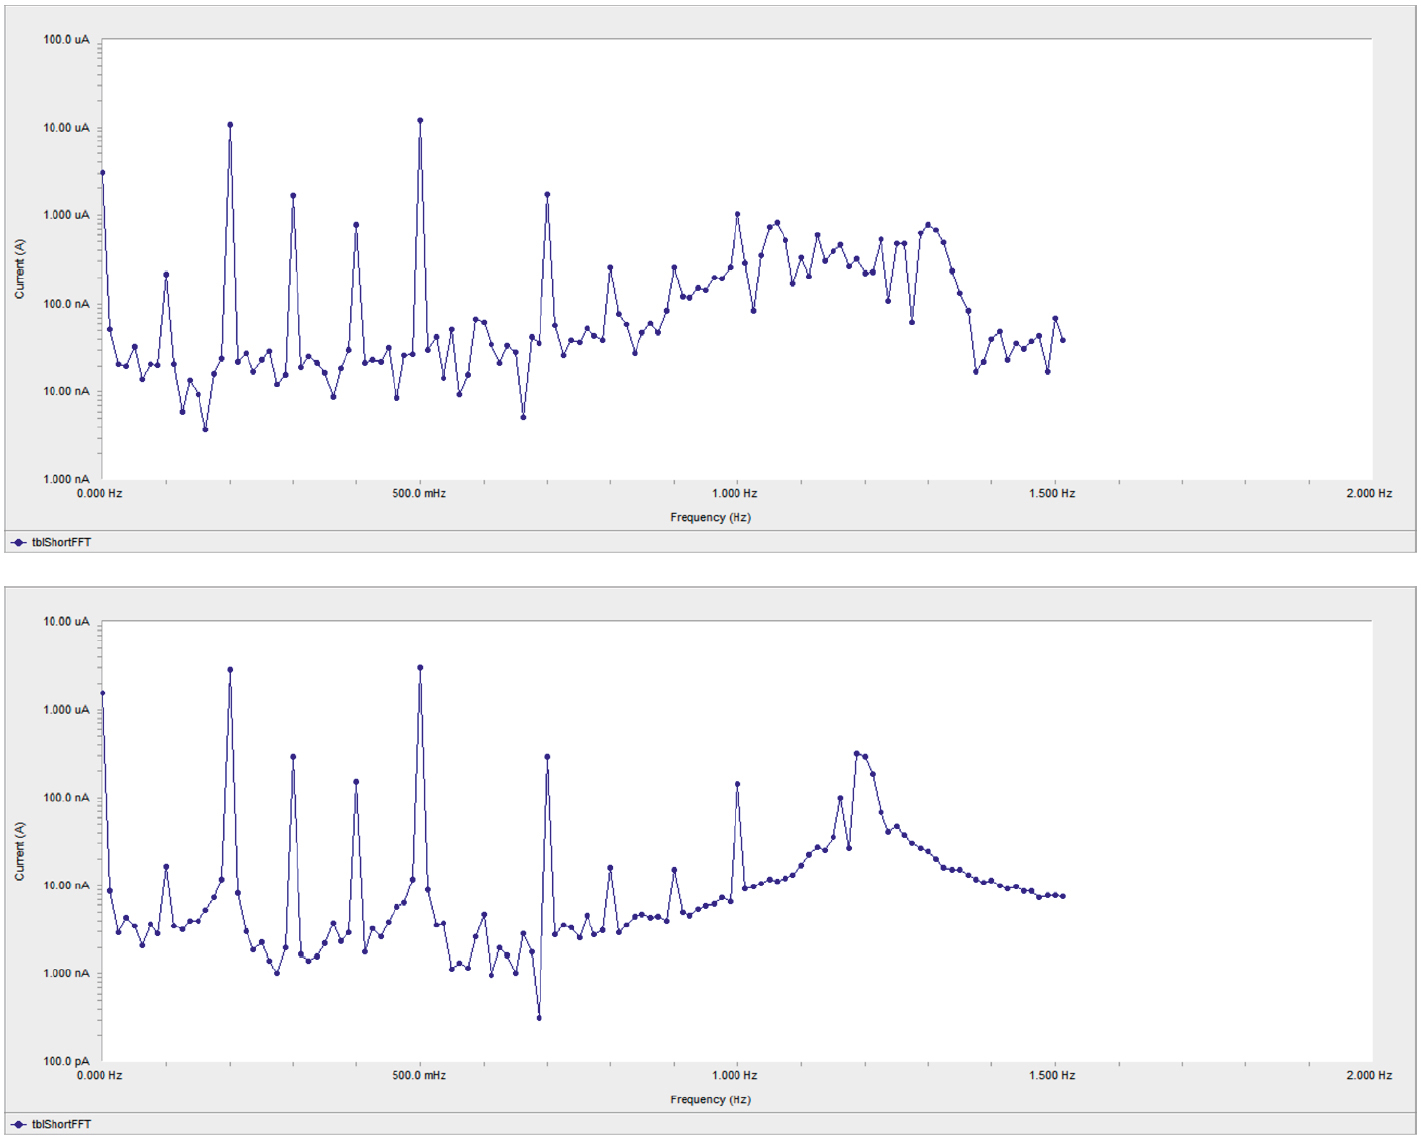
Fig. 8: EFM spectra for copper in of 1 M HNO3 in the absence and presence of 21×10-6 M compound (1)
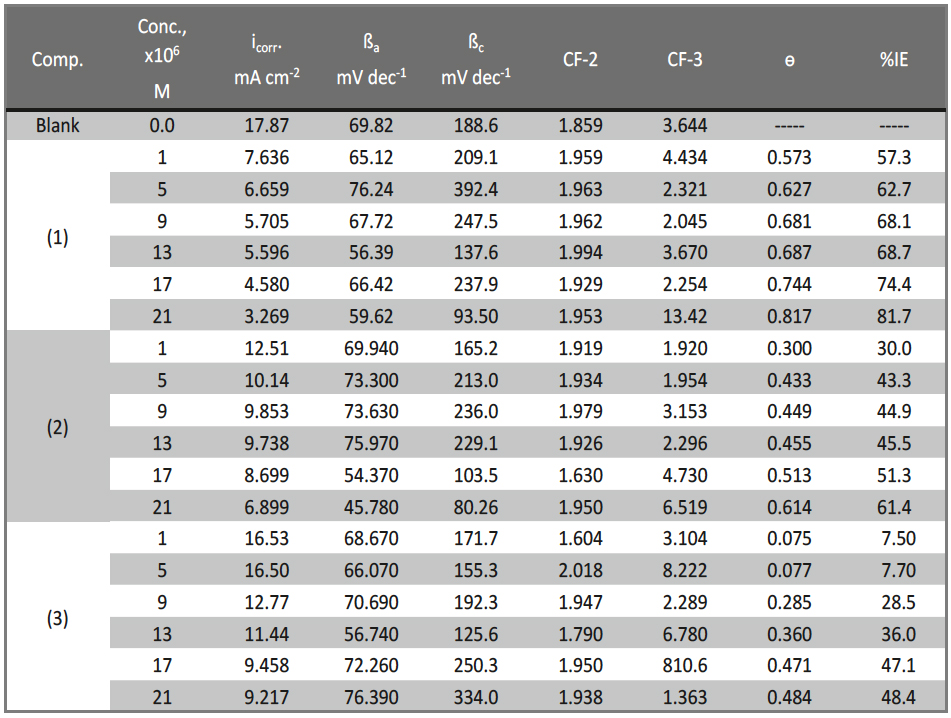
Tab. 8: Electrochemical kinetic parameters obtained by EFM technique for copper in 1 M HNO3 without and with various concentrations of investigated compounds at 30°C
3.7. Quantum Chemical Calculations
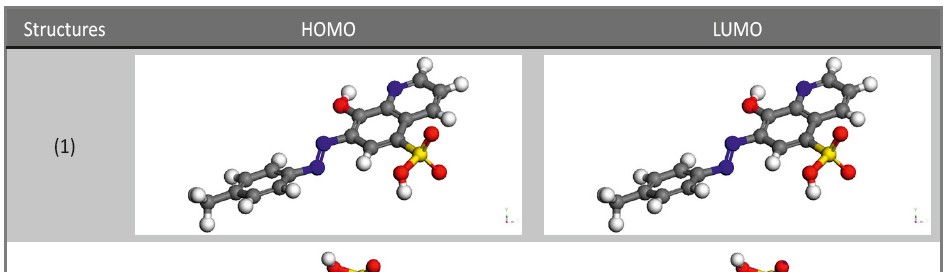
Figure 9 represents the molecular orbital plots and Mullikan charges of investigated compounds.
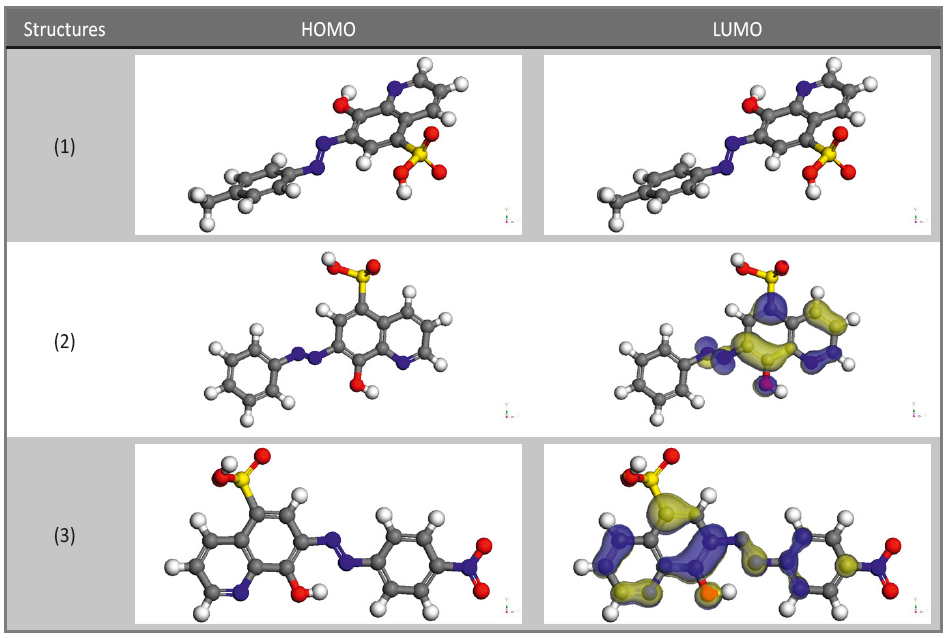
Fig. 9: Molecular orbital plots of investigated compounds
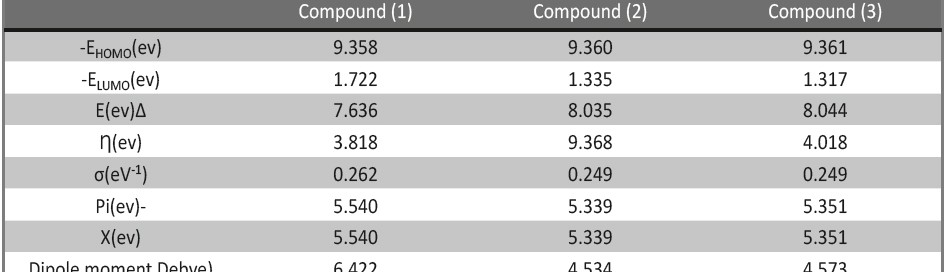
Theoretical calculations were performed for only the neutral forms, in order to give farther insight into the experimental results. Values of quantum chemical indices such as energies of lowest unoccupied molecular orbitals (LUMO) and energy of highest occupied molecular orbitals (HOMO) (EHOMO and ELUMO) the formation heat ΔH and energy gap ΔE, are calculated by semi- empirical PM3 method has given in Table (9). It has been reported that the higher or less negative EHOMO is associated of inhibitor, the greater the trend of offering electrons to unoccupied d orbital of the metal, and the higher the corrosion inhibition efficiency, in addition, the lower ELUMO, the easier the acceptance of electrons from metal surface [54]. The results of Table (10), indicate that ΔE obtained by this method in case of compound (1) is lower than compound (2), is lower than in compound (3). This indicates that compound (1) molecule will absorb more strongly on copper surface than compounds 2 and 3, due to facilitating of electron transfer between molecular orbital HOMO and LUMO, which takes place during its adsorption on the metal surface and thereafter presents the maximum of inhibition efficiency. In addition, it can been seen that EHOMO increases from compound (1) to compound (3) facilitates the adsorption and the inhibition by supporting the transport process through the adsorbed layer. Reportedly, excellent corrosion inhibitors are usually those organic compounds who are not only offer electrons to unoccupied orbital of the metal, but also accept free electrons from the metal [55, 56]. It can been seen that all calculated quantum chemical parameters validate these experimental results.
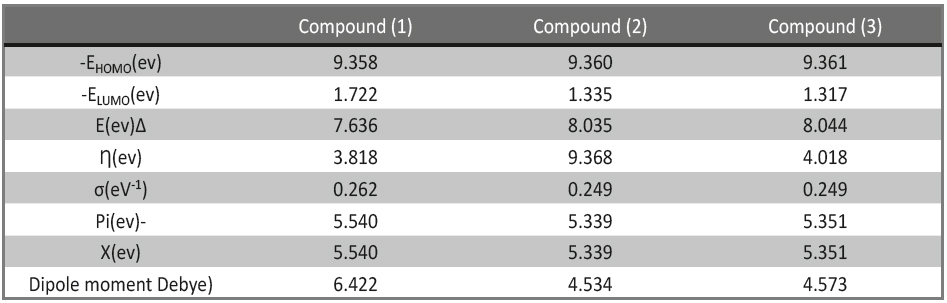
Tab. 9: Calculated quantum chemical parameters for investigated compounds
3.8. Mechanism of Corrosion Inhibition
Inhibition of the corrosion of copper in 1 M HNO3 solution by investigated compounds determined by chemical and electrochemical measurements. It was found that the inhibition efficiency depends on concentration, nature of metal, the mode of adsorption of the inhibitors and surface conditions. The observed corrosion data in presence of these inhibitors, namely: i) the decrease of corrosion rate and corrosion current with increase in concentration of the inhibitor. ii) The linear variation of weight loss with time. iii) The shift in Tafel lines to higher potential regions. iv) The decrease in corrosion inhibition with increasing temperature indicates that desorption of the adsorbed inhibitor molecules takes place and v) the inhibition efficiency was shown to depend on the number of adsorption active centers in the molecule and their charge density. Adsorption on copper surface is assumed to take place mainly through the active centers attached to the inhibitor and would depend on their charge density. Transfer of lone pairs of electrons on the nitrogen atoms to the copper surface to form a coordinate type of linkage is favored by the presence of a vacant orbital in iron atom of low energy. Polar character of substituents in the changing part of the inhibitor molecule seems to have a prominent effect on the electron charge density of the molecule. It concluded that the mode of adsorption depends on the affinity of the metal towards the π-electron clouds of the ring system. Metals such as Cu and Fe, which have a greater affinity towards aromatic moieties, were found to adsorb benzene rings in a flat orientation. The order of decreasing the percentage inhibition efficiency of the investigated inhibitors in the corrosive solution was as follow: compound (1) > compound (2) > compound (3).
Compound (1) exhibits excellent inhibitive power due to: (i) the presence of p-CH3 group, which is an electron-donating group with negative Hammett constant (σ = – 0.17). This group will increase the electron charge density on the molecule (ii) its larger molecular size that may facilitate better surface coverage, and (iii) it has 3N, 4O and one S atoms. Compound (2) comes after compound (1) in inhibition efficiency due to: (i) it has lower molecular size than compound (1) and has no substituent in p-position (H-atom with σ = 0.0) which contributes no charge density to the molecule. Compound (3) is the least effective one in inhibition efficiency because it has p-No2 group, which is an electron-withdrawing group with positive Hammett constant. i.e it lowers the electron density on the molecule and hence, lower inhibition efficiency, in spite of it has larger molecular size than compound 2.
Conclusions
The results proved that 8-hydroxy-7-phenylazo-quinoline-5-sulfonicacid derivatives showed a moderate corrosion inhibition for copper in 1M HNO3 solution. Studied inhibitors are mixed type inhibitors because both anodic and cathodic curves decreased but corrosion, potential remained constant. The percentage inhibition increases with inhibitor concentrations and decreases with rise of temperature. The adsorption of the inhibitor molecules on copper surface obeys Temkin adsorption isotherm. Thermodynamic parameters indicated that the adsorption is spontaneous and endothermic process.
References
- H.Y. Tsai, S.C. Sun, S.J. Wang, J. Electrochern. Soc. 147 (2000)2766.
- A. Krishnarnoorthy. K. Chanda, S.P. Murarka, G. Ramanath,J.G. Ryan, Appi. Phys. Lett., 78 (2001) 2467.
- C.E. Ho, W.T. Chen, C.R. Kao, J.Electro. Mater. 30 (2001)379.
- R.R. Thomas, V.A. Brusic, B.M. Rush, J. Electrochem. Soc. 139(1992) 678.
- C. Fiaud, Proceedings of the Int. Symposium on Control of Copper and Copper Alloys Oxidation, Rouen, France, (1992).97.
- D. Chadwick, T. Hashemi, Corros. Sci. 18 (1978) 39.
- S.L.F.A. da Costa, S.M.L. Agostinho, J. Electroanal. Chem. 296(1990) 51.
- H.A.A. EI-Rahman, Corrosion 47(1991)424.
- N. Bellakhal, K. Draou, A. Addou, J.L. Brisset, J. Appl. Electrochem. 30 (2000)595.
- MM. El-naggar, J. Mater. Sci. 35 (2000) 6189.
- F. Zucchi, G. Trabanelli, C. Monticelli, Corros. Sci. 38(1996)147.
- D. Chadwick, T. Hashemi, Surf. Sci. 89(1979)649.
- S. Yoshida, H. Ishida, Appl. Surf. Sci.20 (1985)497.
- M.H. Wahdan, G.K. Gomma, Mater. Chem. Phys. 47(1997)176.
- S.M. Song, C.E. Park, H.K. Yun, C.S. Hwang, S.Y. Oh, J.M.Park, J .Adhesion Sci. Tehnol. 12 (5) (1998) 541.
- K. Hofmann Imidazole and its Derivatives, Interscience Publishers, Inc, New York, 1953.
- R. F.Anderson, S. S. Shinde, A.Maroz.Org. Biomol. Chem. 6(2008) 1973.
- R. W. Bosch, J. Hubrecht, W. F. Bogaerts, B.C. Syrett, Corrosion 57(2001)60.
- S. S. Abdel—Rehim, K. F. Khaled, N. S. Abd—Elshafi, Electrochim. Acta .51 (2006)6269.
- A. N.Wiercinska, G.Dalmate, Electrochim. Acta. 51 (2006) 6179.
- A.Yurt, A. Balaban, S.U Kandemir., G.Bereket, B.Erk, Mater Chem. Phys. 85(2004) 420.
- A.Y. Etre, Appl. Surf. Sci. 252(2006) 8521.
- A. El-Awady, B. Abd El-Nabey, G. Aziz, Electrochem.Soc., 139 (1992) 2149.
- G. Trabanelli, in “Corrosion Mechanisms” (Ed. F. Mansfeld) Marcel Dekker, New York, 119 (1987).
- A. S. Fouda, A. Abd. E. Aal, A. B. Kandil, J. Dasalination 201 (2006)216.
- F.H. Asaf, M. Abou- Krisha, M. Khodari, F. EL-Cheihk. A. A. Hussien, Mater Chem. Phys., 93 (2002) 1.
- A.Fiala, A. Chibani, A. Darchen. A. Boulkarnh, K. Djebbar, Appl. Surf .Sci. 253(2007) 9347.
- ST. Arab and EM. Noor, Corrosion 49 (1993) 122.
- W. Durnie, R.D. Marco, A. Jefferson, B. Kinsella, I Electrochenm. Soc., 146 (1999) 1751.
- J. M. Thomas and W. J. Thomas, Introduction to the Principles of Heterogeneous Catalysis, 5th Ed, Academic Press, London (1981) 14.
- G. Quartarone, G. Moretti, T. Bellomi, G. Capobianco, A. Zingales, Corrosion 54(1998)606.
- W.D. Bjomdahl, K. Nobe, Corrosion 40 (1984) 82.
- Schumacher, A. Muller, W. Stockel,J.Electroanal. Chem. 219(1987)311.
- W.H. Smyrl, in: J.O.M. Bockris, B.E. Conway, E. Yeager, R.E. White (Eds.), Comprehensive Treatise of Electrochemistry, Plenum Press, New York.4. (1981) 116.
- G. Quartarone, T. Bellomi, A. Zingales, Corros. Sci. 45 (2003) 722.
- J.W. Schltze, K. Wippermann, Electrochim. Acta 32 (1987) 823.
- D.C. Silverman and J.E. Carrico, National Association of Corrosion Engineers, 44 (1988) 280.
- W.J.Lorenz and F. Mansfeld, Corros.Sci. 21 (1981) 647.
- D. D. Macdonald, M. C. Mckubre. “Impedance measurements in Electrochemical systems,” Modern Aspects of Electrochemistry, J.O’M. Bockris, B.E. Conway, R.E.Whitc, Eds., Plenum Press, New York, New York, .14(1962)81.
- F. Mansfeld; Corrosion, 36(1981), 301.
- C. Gabricili, “Identification of Electrochemical processes by Frequency Response Analysis,”Solarton Instrumentation Group, 1980.
- M. El Achouri, S. Kertit, H.M. Gouttaya, B. Nciri, Y. Bensouda, L. Perez, M.R.Jnfante, K. Elkacerni, Prog. Org. Coat., 43 (2001) 267.
- J.R. Macdonald, W.B. Johanson, in: J.R. Macdonald (Ed.), Theory in Impedance Spectroscopy, John Wiley& Sons, New York, 1987.
- S.F. Mertens, C. Xhoffer, B.C. Decooman, E. Temmerman, Corrosion 53 (1997) 381.
- G. Trabanelli, C. Montecelli, V. Grassi, A. Frignani, J. Cern. Concr., Res. 35 (2005) 1804.
- A. J. Trowsdate, B. Noble, S .J. Hans, I.S. R. Gibbins, G. E. Thomson, G. C. Wood, Corros. Sci., 38(1996)177.
- F.M.Reis, H.G.de Melo and I. Costa, J.Electrochem. Acta, 51(2006)17.
- M. Lagrenee, B. Mernari, M. Bouanis, M. Traisnel & F. Bentiss, Corros. Sd., 44 (2002) 573.
- E. McCafferty. N. Hackerman, J.Electrochern. Soc. 119 (1972) 146.
- H. Ma. S. Chen. L. Niu. S. Zhao. S. Li. D. Li. J. Appl. Electrocherm 32 (2002) 65.
- E. Kus, F. Mansfeld, Corros. Sci. 48 (2006) 965.
- G. A. Caigman. S. K. Metcalf, E. M. Holt, J.Cheni. Cryst. 30 (2000)415.
- M. Vajpeyi, S. Gupta, Dhirendra and G. N. Pandey, Corros. Prev. Control, October (1985)102.
- F. Samie, J. Tidblad, V. Kucera, C. Leygraf, 39, (2005) 7362.
- F. Samie, J. Tidblad, V. Kucera, C. Leygraf,, 40, (2006) 363 1.
- I. Lukovits, K. Palfi, E. Kalman, Corrosion, 53(1997)915.74-P. Zhao, Q. Liang, Y. Li,Appl. Surf Sci., 252 (2005) 1596.
PDF Version of the article |
Flash Version of the article |
|
| [qr-code size=”2″] | ||