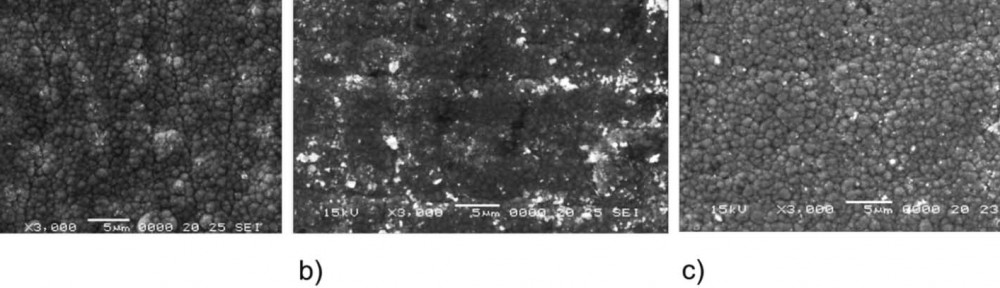
 Fig. 2: SEM images: a) Zn-Ni sample, b) SiO2 + Zn-Ni + bp + f sample, and c) SiO2 + BN + Zn-Ni + f sample
The tribological behavior of an electrodeposited Zn-Ni alloy layer has been investigated to understand the effect of substrate and electroplating methods. The substrates used were: steel, steel/silicon dioxide and steel/silicon dioxide/boron nitride. The tribological behavior was investigated using a ball-on-plate tribometer equipped with an electrochemical cell with 1 % NaCl solution. Open circuit potential measurements, chrono-amperometry (CA) (constant potential electrolysis technique – CPE) measurements and electro-chemical impedance spectroscopy (EIS) measurements were made, before and after a wear test. The coefficient of friction was also measured. The structure and morphology of the electrodeposited layers and the nature of the corrosion products were determined using SEM, XRD and AFM measurements. The Zn-Ni coating electrodeposited using pulse current electrodeposition on steel/silicon dioxide/boron nitride substrate was found to have a higher tribocorrosion resistance compared to the Zn-Ni layers electrodeposited by using pulse current electrodeposition and electrodeposition in a magnetic field on steel/silicon dioxide or by conventionally electrodeposited on steel substrate.
1 Introduction
Zinc-nickel alloy electroplated on steel has a good corrosion resistance in the absence of wear. However, a combined effect of wear and corrosion can notably decrease the corrosion resistance, when the Zn-Ni layer is damaged by wear.
The wear-corrosion synergistic effects require a fundamental understanding of the mechanisms involved, with the aim to achieve a significant reduction of such effects.
In general, metals react in aqueous environment and show an active-passive behavior [1]. In such systems, the combined action of wear and corrosion is important, as wear can damage the protective oxide film. Depending on the oxide film properties (stability, adherence) and the repassivation kinetics, the combined effect of corrosion and wear can
accelerate the metal loss [2]. A detailed description of corrosion/wear interaction can be quite difficult to make. In general, it is stated that cracking and oxide film exfoliation from the surface can lead to active metal exposure to environment. The exposure can be followed by a local dissolution of the oxide film, or the active metal repassivation – depending on metal/electrolyte system (solution) and on loading conditions.
In the last decade, several studies were carried out in the domain of surface engineering regarding tribocorrosion of tough surfaces, with regard to the base metal protection [5, 6–10]. Zn-Ni alloy coatings have become the choice for corrosion protection in automobile, aerospace and other applications due to their superior mechanical properties and their good corrosion behavior. Investigations have also been performed regarding the Zn-Ni alloy corrosion behavior [4, 11–15], mechanical properties; and tribological general studies [16].
Three different electrochemical methods were used to study the coating corrosion behavior: open circuit potential (OCP), chronoamperometry (constant potential electrolysis technique – CPE) and electrochemical impedance spectroscopy (EIS). Wear test and coefficient of friction measurements were also performed. The surface structure and morphology were characterized based on XRD, SEM and AFM measurements.
The purpose of this study is to investigate the corrosion and tribological behavior of Zn-Ni layers electroplated on steel, steel/silicon dioxide (SiO2) and steel/silicon dioxide (SiO2)/boron nitride (BN) substrates, when sliding in 1 % NaCl solution.
2 Experimental setup
2.1 Experimental samples
The substrate used for the electrochemical deposition was a 9 cm2 square sheet of hot rolled carbon steel (S235JR – EN 10025). The steel samples were grounded with 1500 grit sandpaper. After grinding, the samples were degreased in 10 % NaOH solution, washed, pickled in hydrochloric acid solution (HCl 1 : 1), and washed again.
In order to improve the corrosion resistance, a diode-like intermediate layer was attempted, so that the corrosion current would be as low as possible.
The silicon dioxide coating on steel surface was obtained by dipping the samples for 2 minutes in sodium metasilicate (Na2SiO3) solution, followed by 3 minutes dipping in 12 % HCl solution. The silicon dioxide layer formed was of approximately 200 nm thick.
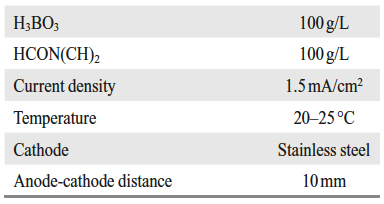
In order to obtain a diode-like intermediate layer, boron nitride (BN) was electrodeposited [3] by mounting the samples as anode. The boric acid mixed with dimethylformamide (CH3)2NC(O)H determine in solution the formation of borate (BO3)– and nitrogen ions N–, according to the following chemical reaction: H3BO + HCON(CH3)2 + H2O → 3 H+ + (BO3)– + CO2 +N– + 2 (CH3)+ + 2 H+, which resulted in silicon dioxide contamination with trivalent boron. The electrodeposited boron nitride layer was of approximately 20 nm thick.
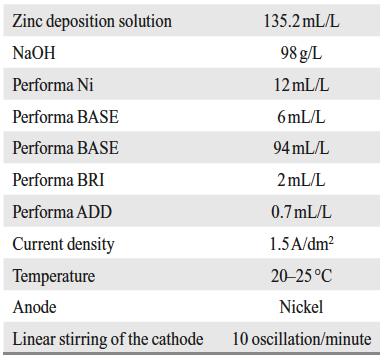
The proportions of each element used to obtain an electrolyte were determined from experimental tests and found that these proportions deposit is optimal. Our intention was to obtain a layer with semiconducting properties.
The Zn-Ni alloy was electrodeposited on the substrate using three different methods: the conventional method, the pulse current electrodeposition method and the electroplating in magnetic field method.
The pulse current electrodeposition was performed using a rectangular pulse generator (ON/OFF) with: ON time Ton = 10 ms and OFF time Toff = 15 ms. The magnetic field used was of 70 mT with the field lines directed parallel to the sample surface.
From experimental tests it was found that the corrosion resistance is higher when the pulse frequency is between 30 and 60 Hz and the effective pulse duration of (Ton) is lower than the pause (Toff). We chose a frequency of 40 Hz and a current density of 1.5 A/dm2.
The intermediate layer (the layer between steel substrate and Zn-Ni alloy) was silicon dioxide and silicon dioxide contaminated with boron nitride, as described above.
The three types of samples used in the experiments are given in Table 1.
Tab. 1: Experimental samples
The electrolytes’ compositions and other parameters used for Zn-Ni alloy deposition and for boron nitride (BN) deposition are given in Tables 2 and 3.
Tab. 2: Zn-Ni alloy deposition electrolyte and other
parameters
Tab. 3: Boron nitride (BN) deposition electrolyte and
other parameters
The chemicals, Performa Ni, Performa BASE, Performa BRI and Performa ADD, were purchased from CONVENTYA S.A.S. company, France.
2.2 Open circuit potential (OCP) test
Open circuit potential curves were plotted in order to study samples thermodynamic behavior in 1 % NaCl solution, using a potentiostat.
The electrochemical cell consisted of a reference electrode (Ag/AgCl), a platinum auxiliary electrode and the sample as working electrode.
The samples were not subjected to wear during the first four minutes of testing, and then, they were subjected to wear for the next 26 minutes.
2.3 Chrono-amperometry test
The chrono-amperometric curves were plotted for the study of coatings reaction kinetics in 1 % NaCl solution, using a potentiostat.
A 200 mV potential was applied for 30 minutes to the working electrode versus the open circuit potential (OCP).
The samples were not subjected to wear during the first four minutes of testing, and then, the samples were subjected to wear for the next 26 minutes.
2.4 Electrochemical impedance spectroscopy (EIS) test
The EIS test was performed in 1 % NaCl solution. The impedance data were obtained at open circuit potential using a potentiostat equipped with a frequency response analyzer. Impedance measurements were performed in a frequency range of 100 kHz to 1 MHz using a 10 mV amplitude sine wave. The experimental data provided by the potentiostat were collected using Voltamaster4 software and the impedance spectra were analyzed using ZView software.
The EIS test was performed before and after the wear test.
2.5 Wear test
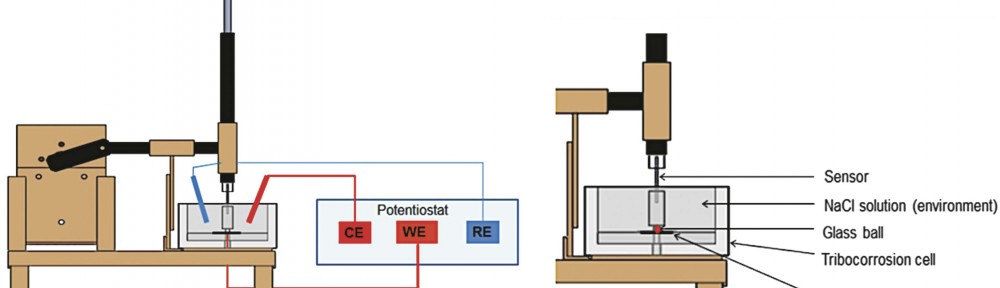
The tribocorrosion test for all samples was performed using a ball-on-plate tribometer (Fig. 1). The tribometer is a pin on disc type, where the pin has a spherical tip (to simplify the contact geometry) and performs a linear alternating motion (oscillating motion) on the surface of the sample. In this case the pin is moving and the sample is stationary. Coefficient of friction is determined by the ratio of the frictional force to the loading force on
the pin. The electrochemical cell attached to the tribometer contained 1 % NaCl solution. Tests were carried out at room temperature (25 to 27 °C). A friction coupling formed between the Zn-Ni layer and the 7 mm diameter glass ball. Three electrodes were used for the OCP and the current density measurement: working electrode (the sample), reference electrode (Ag/AgCl) and auxiliary electrode (platinum). The electrodes were connected to the potentiostat. The pin has a linear oscillating motion on the surface of the sample. Tests were carried out for a sliding distance of 14 mm, at a frequency of 0.5 Hz, resulting a sliding total distance of 21,84 m, during 780 cycles. All samples were tested under the load of 2 N, and the force of friction and coefficient of friction were determined by using a strain gauge sensor.
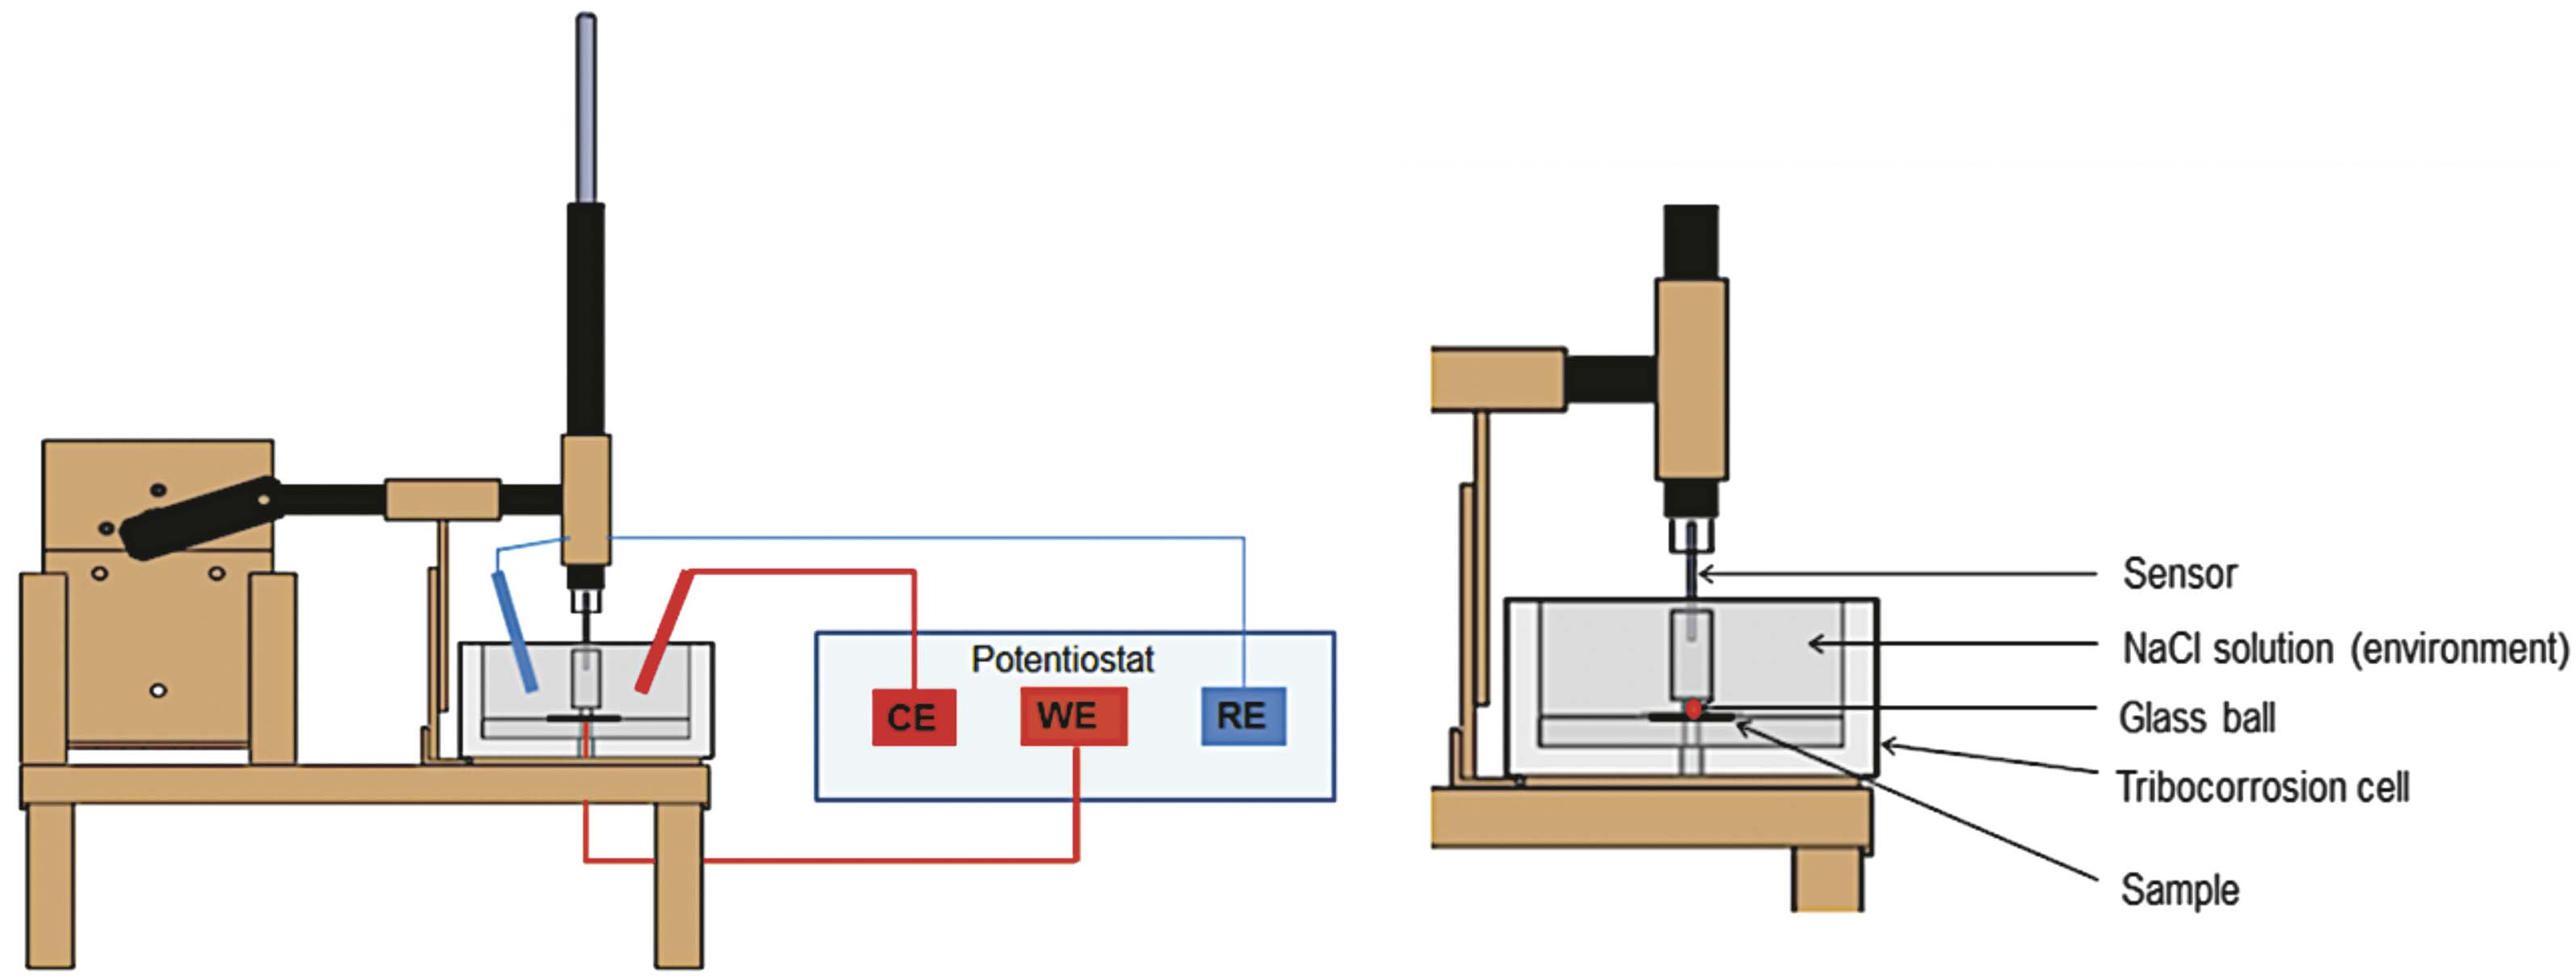
Fig. 1: Experimental stand for tribocorrosion test
The sample surface (9 cm2) was entirely exposed to the corrosive environment; however, an area of 14 x 0.7 mm was exposed to wear.
For the given ball-on-plate tribometer configuration, and according to the Hertz model, the contact surface pressures are given in Table 4.
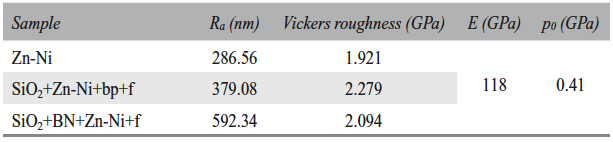
Tab. 4: Roughness, hardness, elasticity modulus and contact pressures
2.6 Coating morphology
The layer’s crystalline structure was analyzed using X-ray diffraction method (XRD), using a Bruker D8 high-resolution diffractometer with a copper anode (CuKα1=1.54056 Å). The XRD was used to determine the crystalline phases of Zn-Ni alloy and to determine the structural and micro-structural properties of these phases, such as the crystallites size and the preferential crystallographic orientation. The morphology of the deposit was determined using scanning electron microscopy (SEM) and atomic force microscopy (AFM). A high-resolution scanning electron microscope JEOL JSM 5600 LV equipped with an electron backscatter diffraction detector (EBSD) was used to analyze the crystallographic orientations in a range of 100 nm. A Veeco atomic force microscope type D3100 was used.
3 Results and discussions
3.1 Layer characterization
Figure 2 shows the SEM images of the coating surface. The deposited Zn-Ni grain size was found to be less than 1 µm for all samples (Fig. 2).
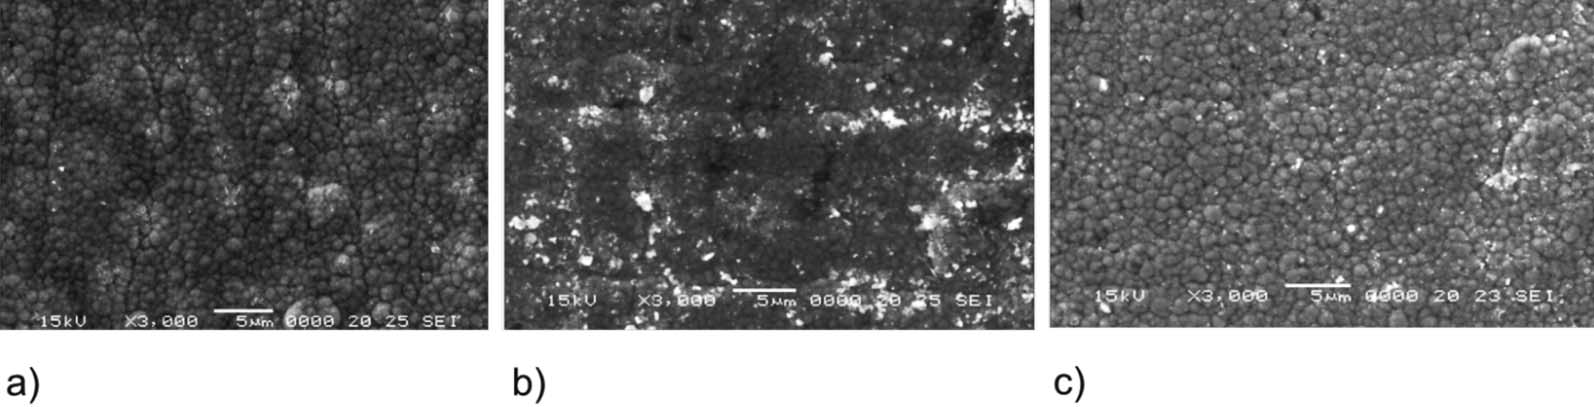
Fig. 2: SEM images: a) Zn-Ni sample, b) SiO2 + Zn-Ni + bp + f sample, and c) SiO2 + BN + Zn-Ni + f sample
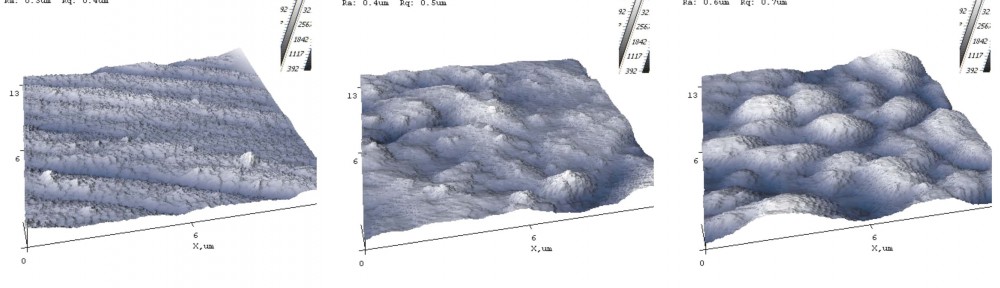
The AFM images are given in Figure 3. The surface roughness is lower in the conventionally electrodeposited sample (Zn-Ni), while the silicon dioxide containing samples show higher roughness.
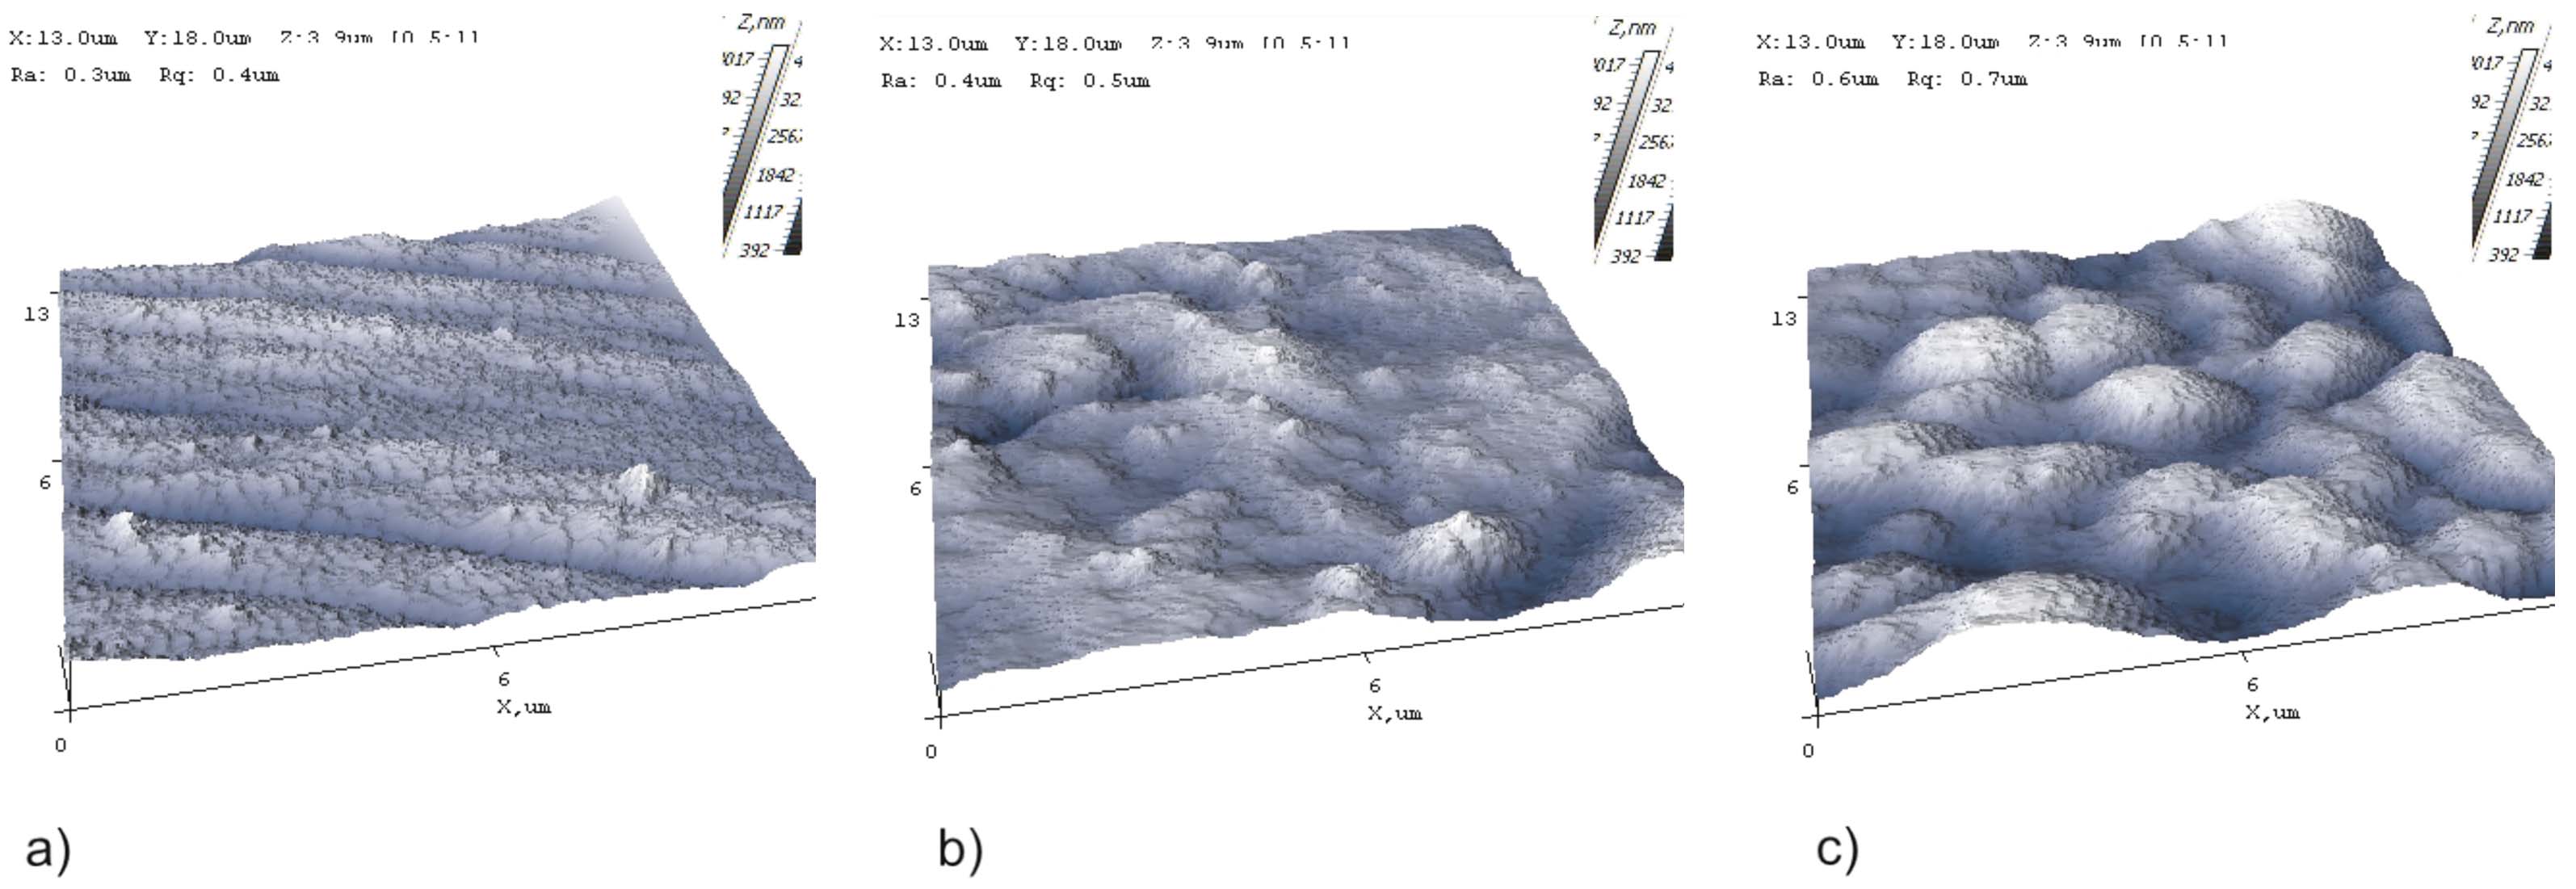
Fig. 3: AFM images: a) Zn-Ni sample, b) SiO2 + Zn-Ni + bp + f sample, and c) SiO2 + BN + Zn-Ni + f sample
The Zn-Ni layer analysis was performed based on the X-ray diffractograms. The crystallographic orientation and the crystallite size are given in Table 5.
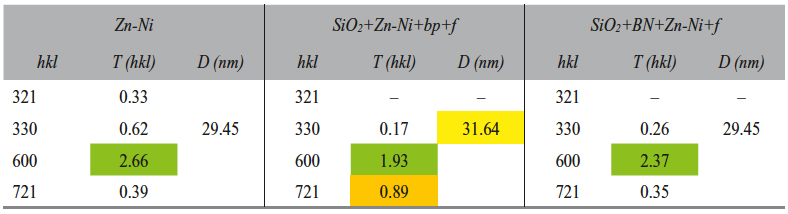
Tab. 5: The preferential crystallographic orientation coefficient and crystallite size
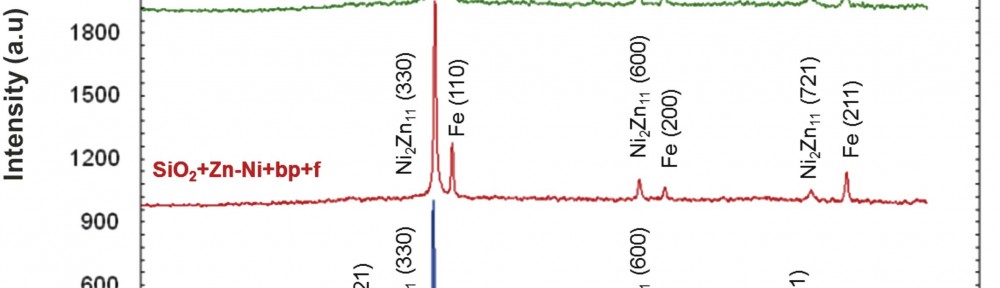
According to the diffractograms (Fig. 4) analysis and to the Table 5 data, the electrodeposited layer consisted of Zn-Ni intermetallic γ phase and the pre-ferential crystallographic growth direction was (600) for all samples, and (721) for the SiO2+Zn-Ni+bp+f sample (where the T(hkl) coefficient had a value closing to 1). The presence of silicon dioxide and of boron nitride and the variation of electrodeposition methods could be correlated with the nucleation and crystal growth competition.
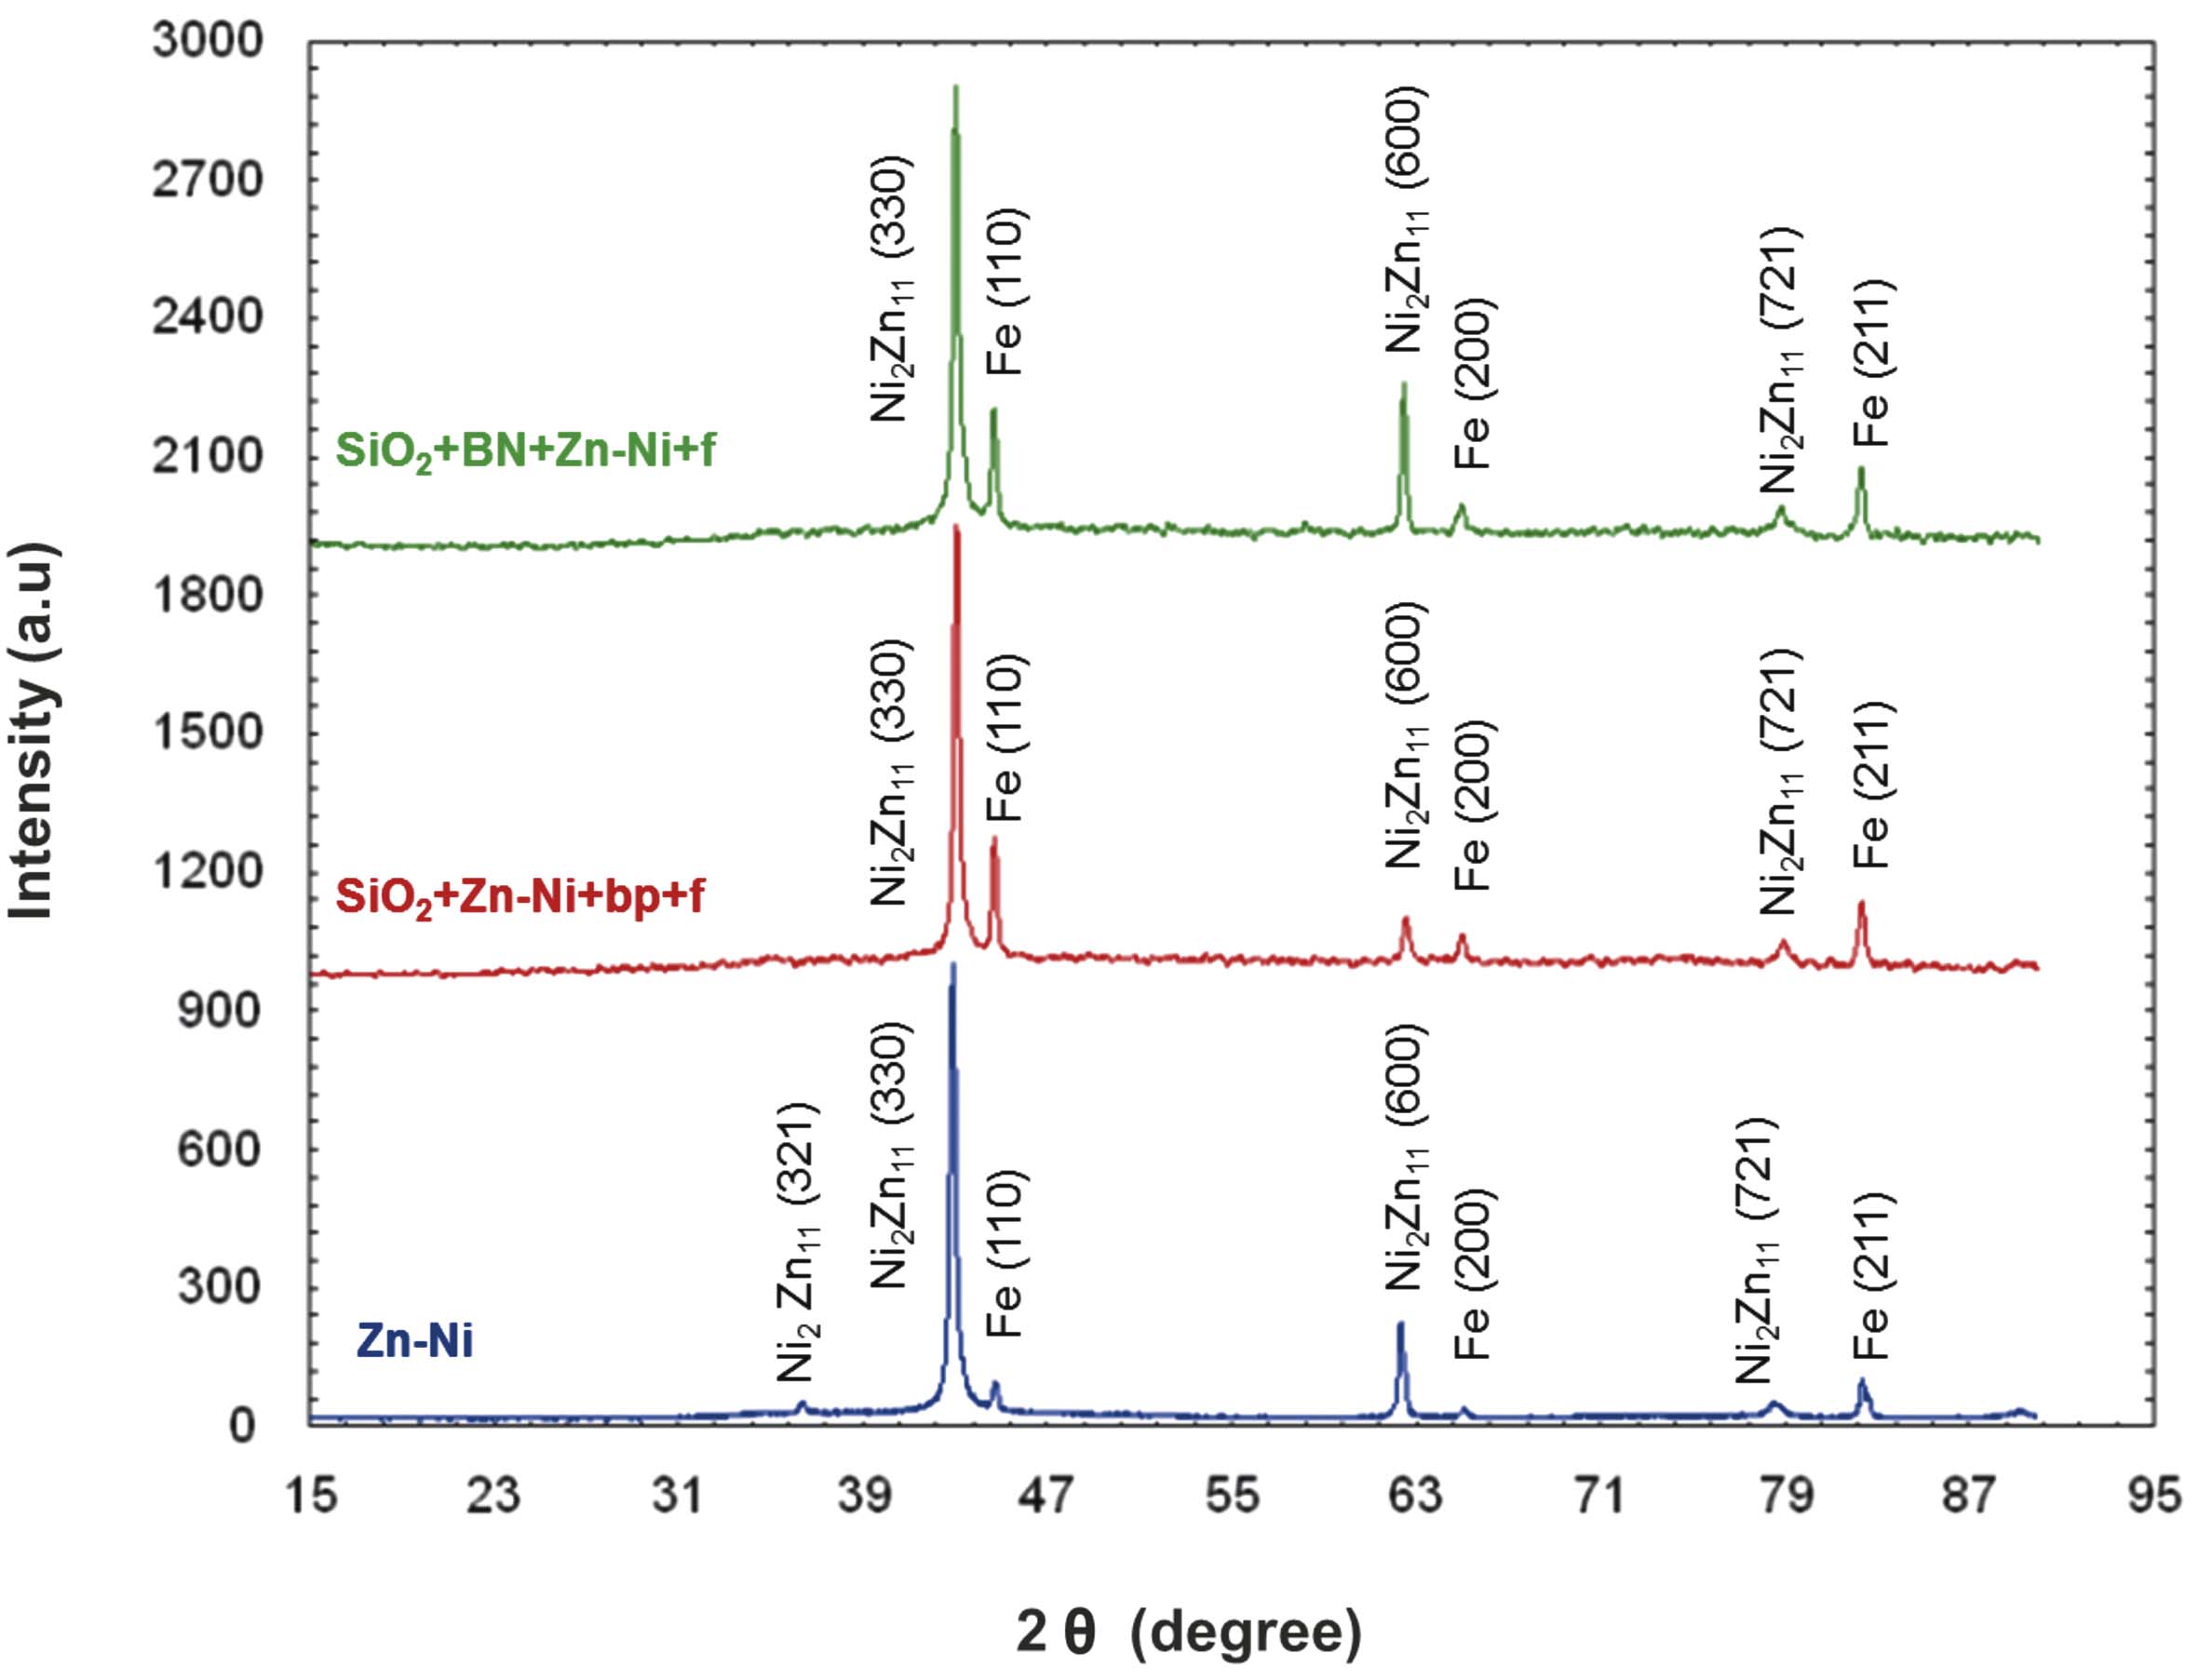
Fig. 4: Diffraction spectra of sample coatings
3.2 Open-circuit potential results
The open circuit potential variation is shown in Figure 5.
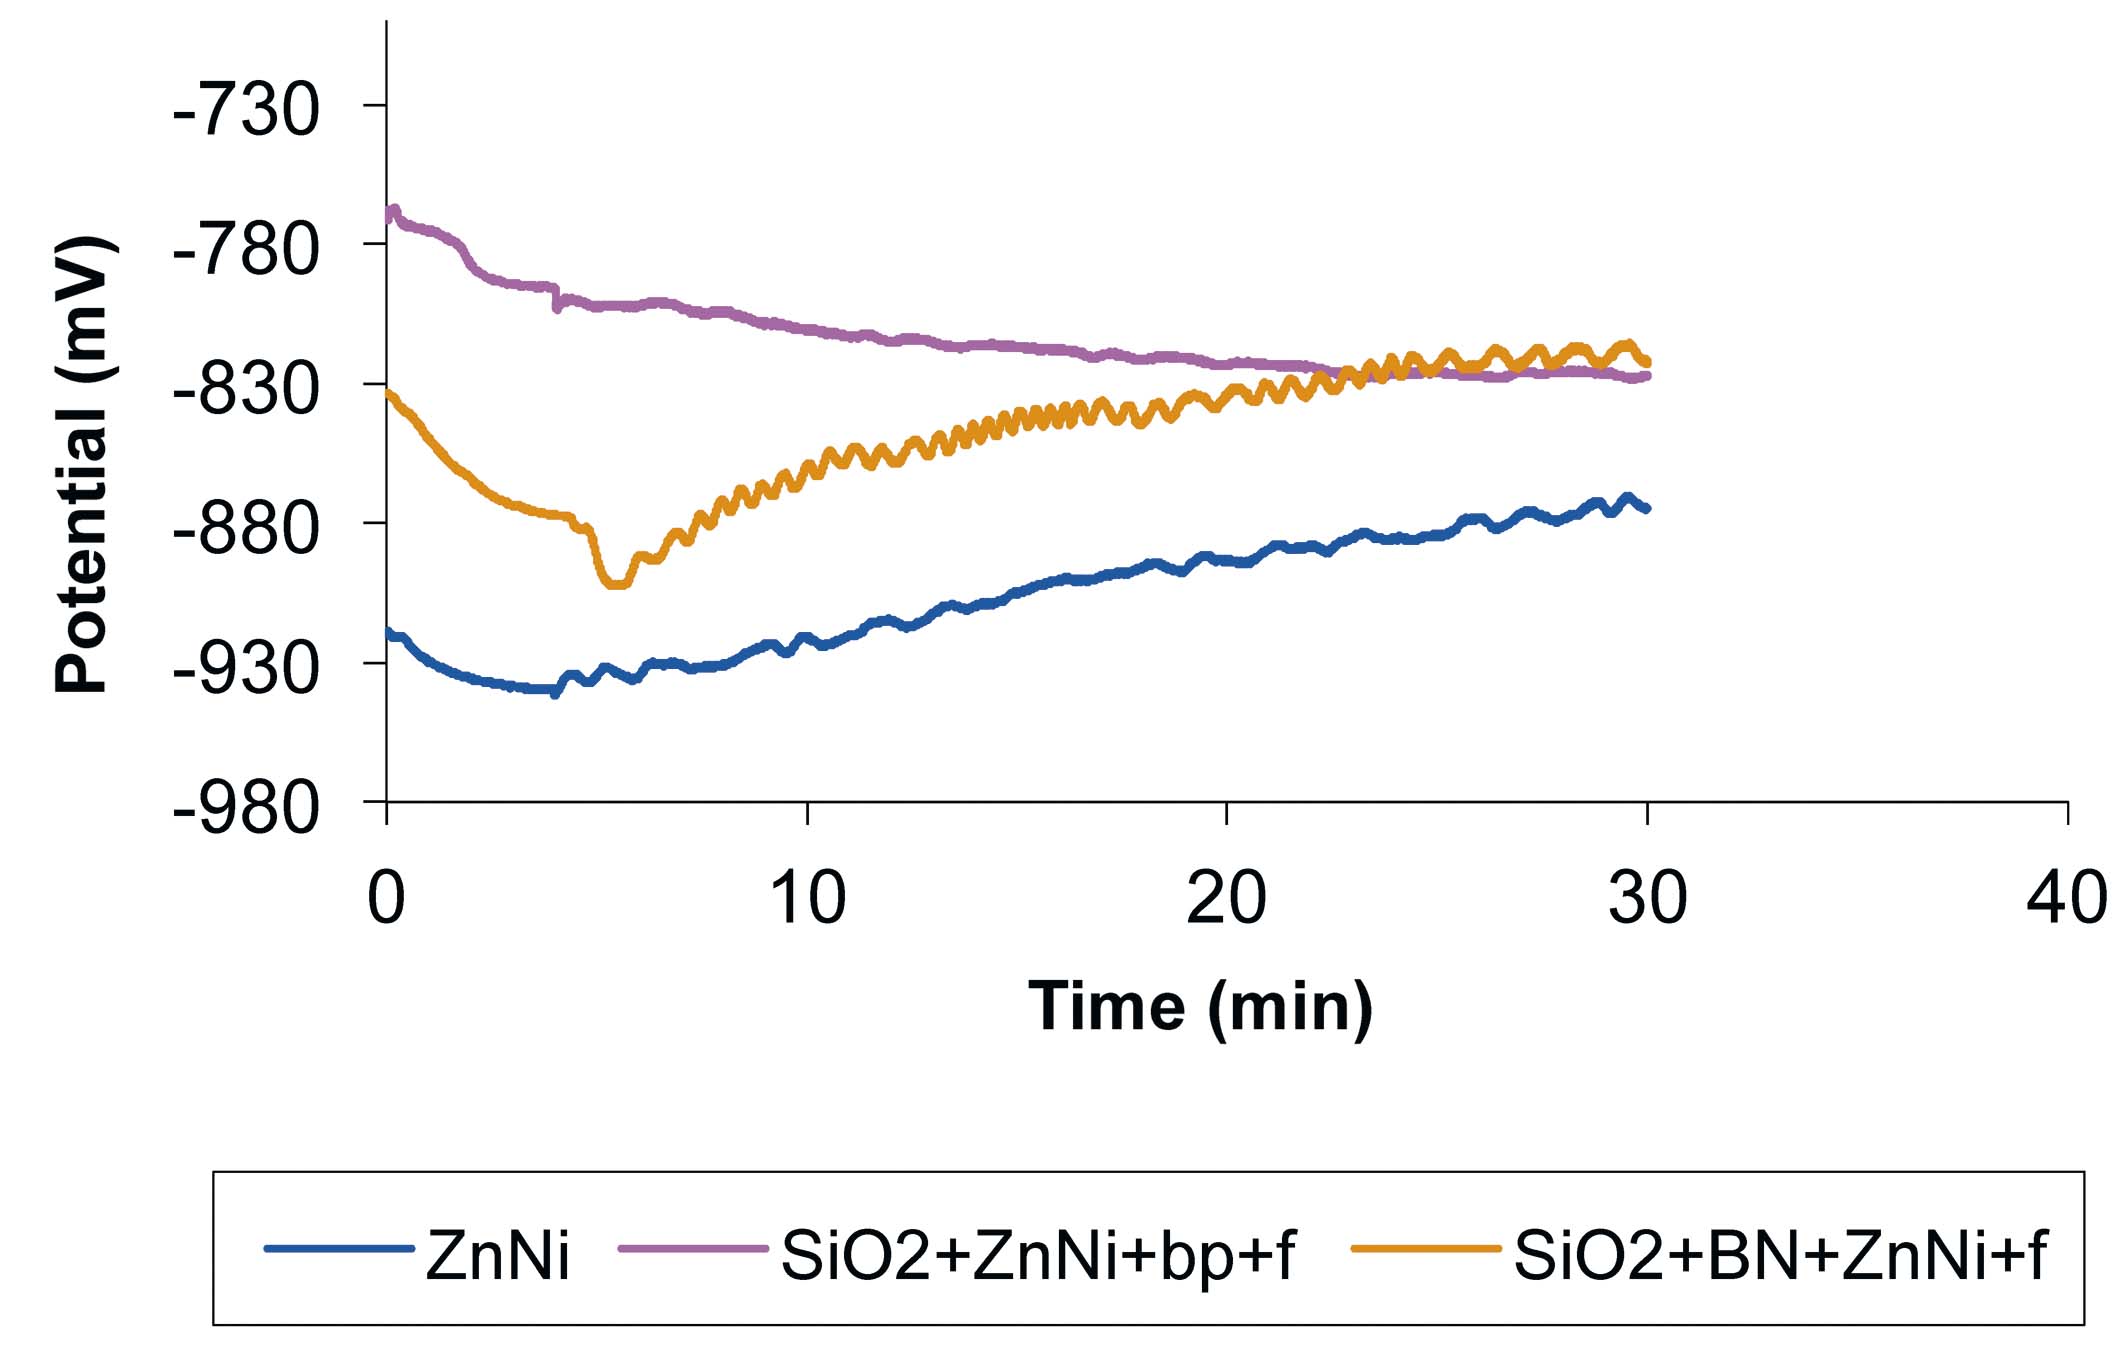
Fig. 5: Open circuit potential variation for: Zn-Ni sample, SiO2+Zn-Ni+bp+f sample and SiO2+BN+Zn-Ni+f sample, during tribocorrosion process in 1 % NaCl solution, with the following tribometer parameters: 0.5 Hz, 14 mm, 780 cycles and a normal force of 2 N
The potential shifted from -940 mV to –918 mV (Fig. 5) during the first 4 minutes (when no sliding was applied) in the case of the Zn-Ni sample, as a result of ion released in solution and surface corrosion. A positive potential shift was observed when friction was applied. This positive potential shift corresponds to the formation and removal of the passive oxide layer. During the friction time, the potential shifted from –940 mV to –874 mV.
A negative potential shift from –767 mV to –796 mV was observed (Fig. 5) during the first 4 minutes in the case of the SiO2 + Zn-Ni + bp + f sample, due to ion released in solution and surface corrosion. A negative potential shift was observed when friction was applied. The potential variations along the plotted curve were small, meaning that the oxide layer was thin, and the layer dissolution occurred under a combination of chemical and mechanical factors. During the last 5 minutes of the test, the potential remained stable. During the friction time, the potential shifted from –796 mV to –827 mV.
A negative potential shift from –833 mV to –878 mV was observed (Fig. 5) during the first 4 minutes in the case of SiO2+BN+Zn-Ni+f sample, due to ions released in solution and surface corrosion. A positive potential shift was observed when friction was applied. This positive potential shift corresponds to the formation and removal of the passive oxide layer. During the friction time, the potential shifted from –878 mV to –815 mV.
According to the OCP analysis it was found that the SiO2+BN+Zn-Ni+f sample had the best tribo corrosion resistance. Although the Zn-Ni sample potential had a positive shift tendency, it was more negative compared to the SiO2+Zn-Ni+bp+f sample potential that had a negative shift tendency and finally remained stable.
In the case of Zn-Ni and SiO2+BN+Zn-Ni+f samples, a potential shift was observed during the samples submission to wear, due to surface passivation. This shows that the oxide layer that covered the surface was increasingly thicker and the oxide layer removed by the counterpart (for each cycle) was increasingly thinner.
The SEM images shown in Figures 6, 7 and 8, support the OCP test findings.
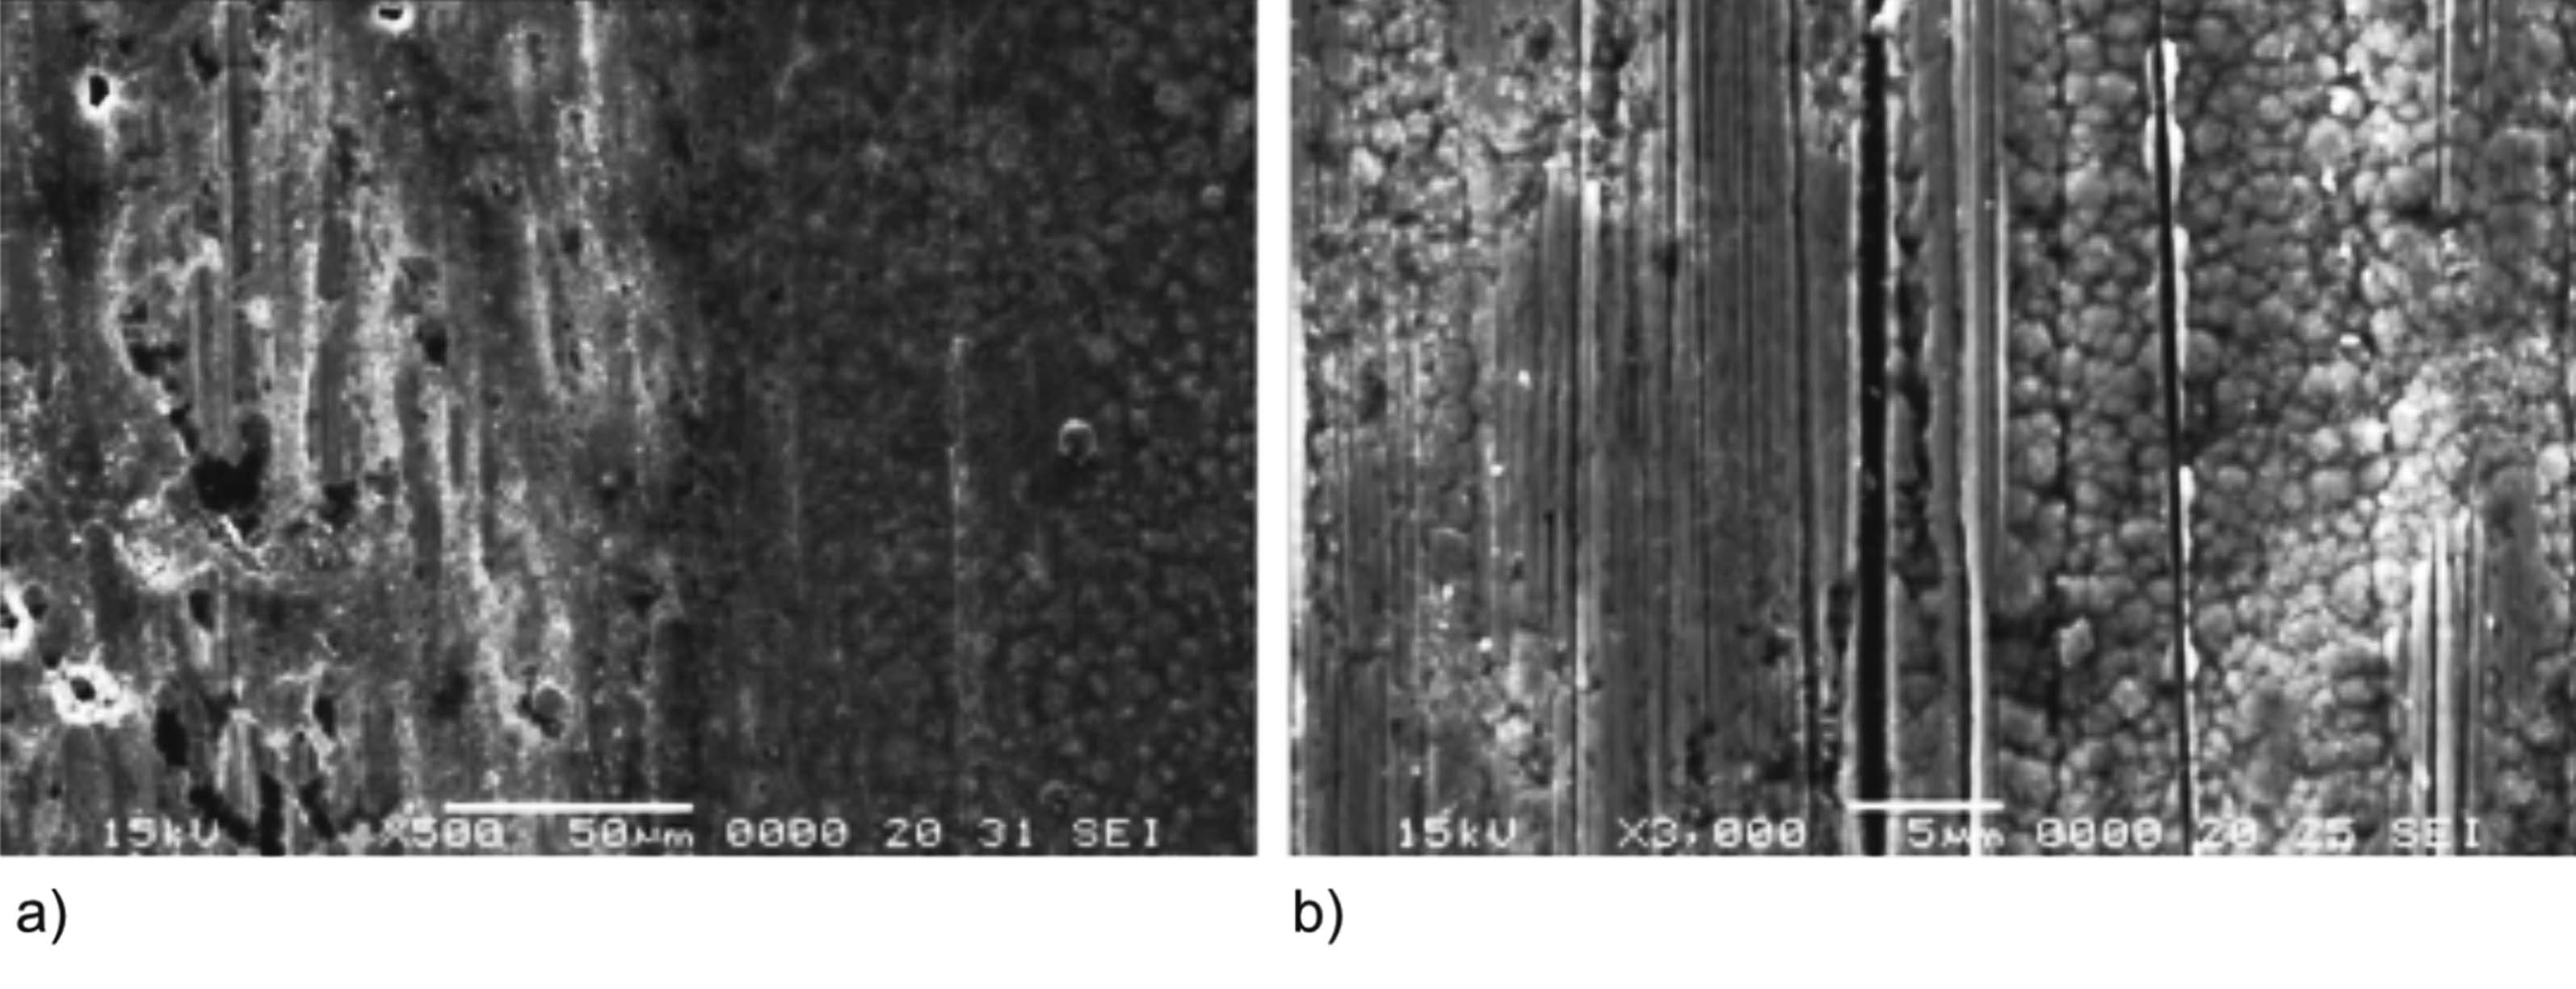
Fig. 6: SEM images of Zn-Ni sample: a) corrosion and tribocorrosion; b) tribocorrosion
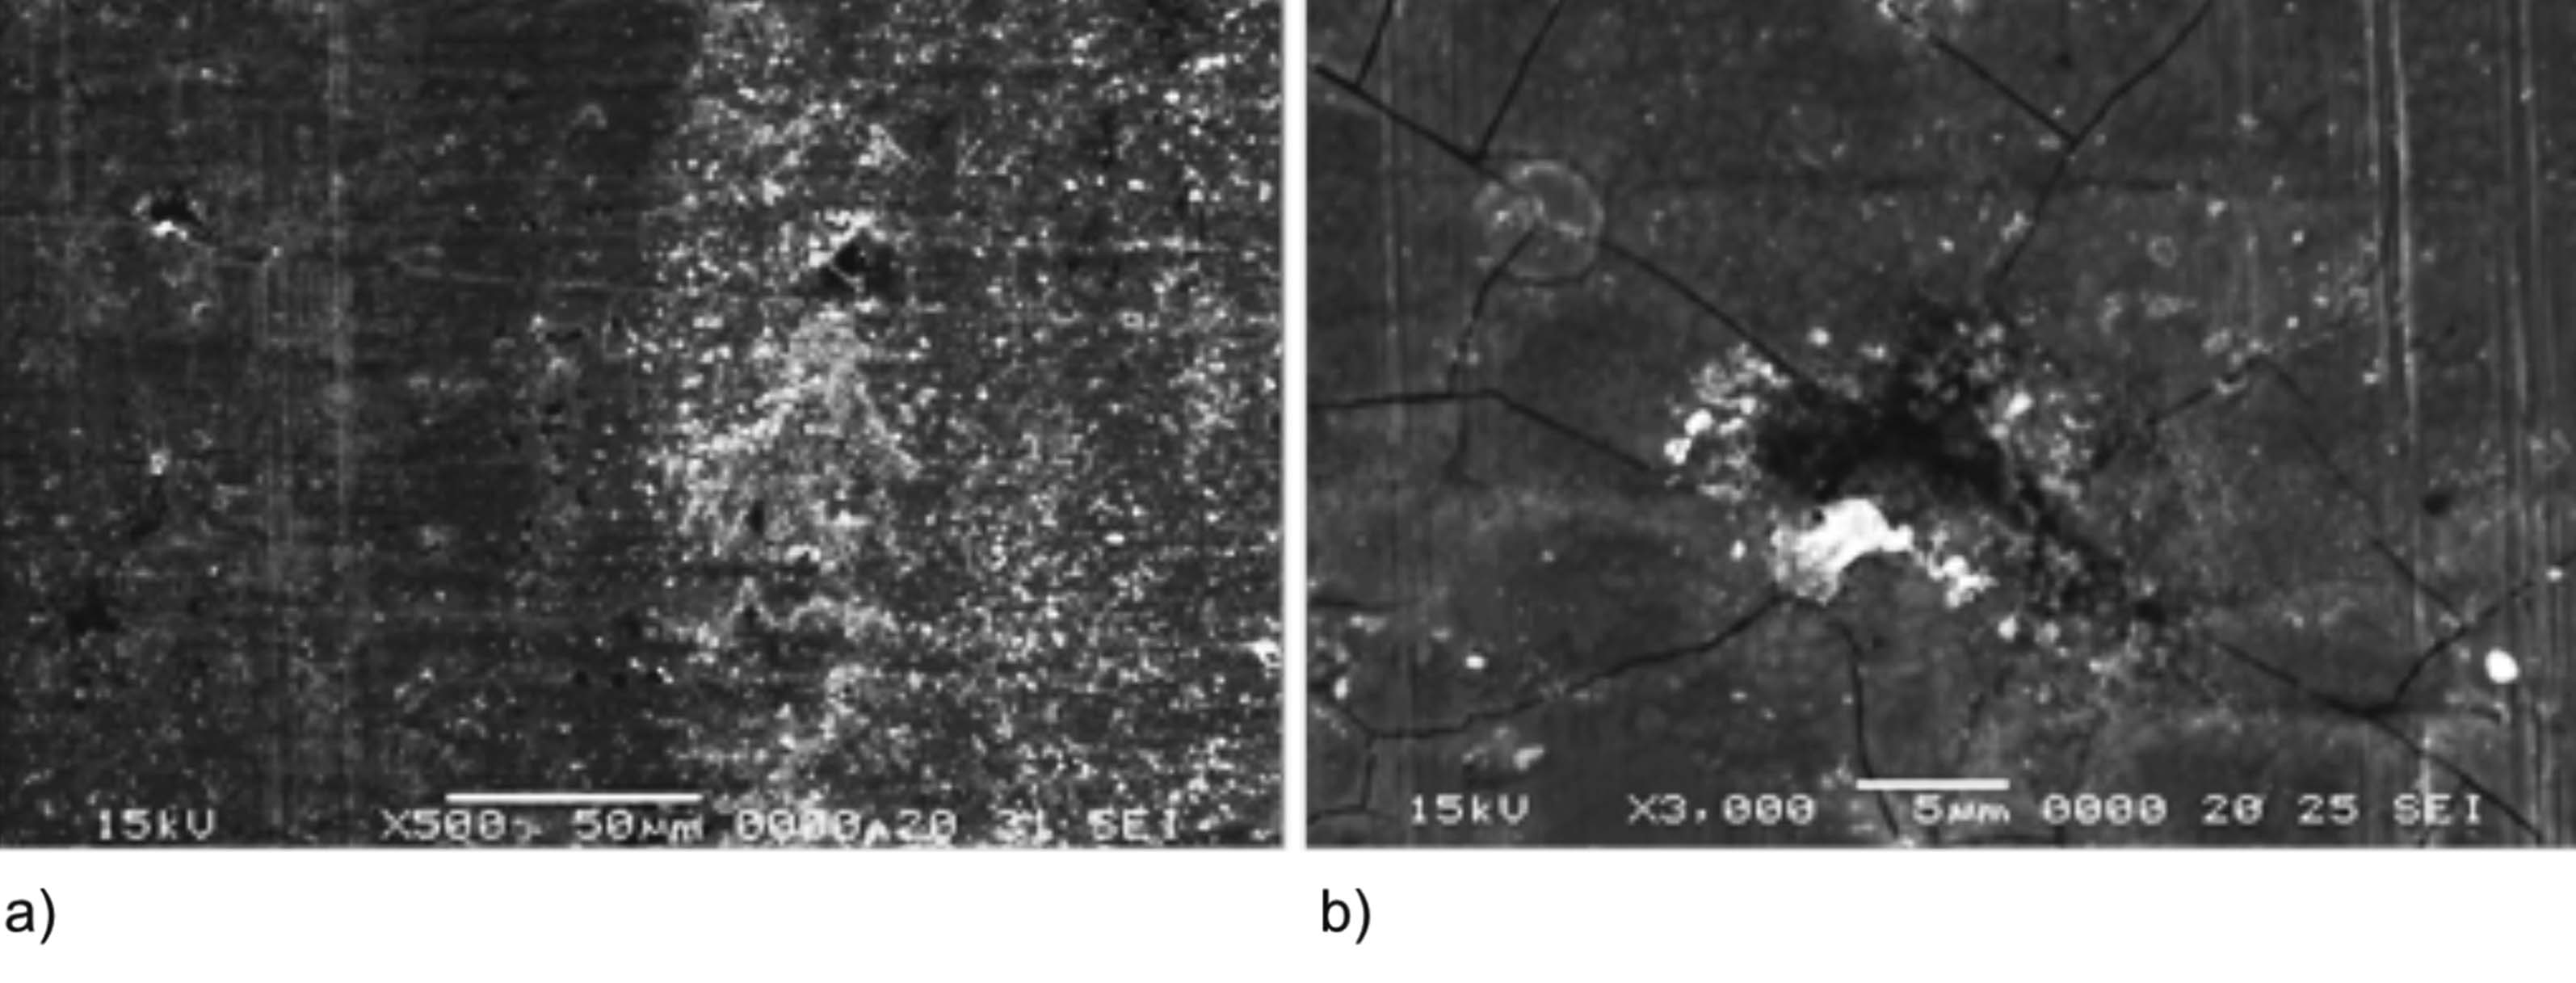
Fig. 7: SEM images of SiO2+Zn-Ni+bp+f sample: a) corrosion and tribocorrosion; b) tribocorrosion
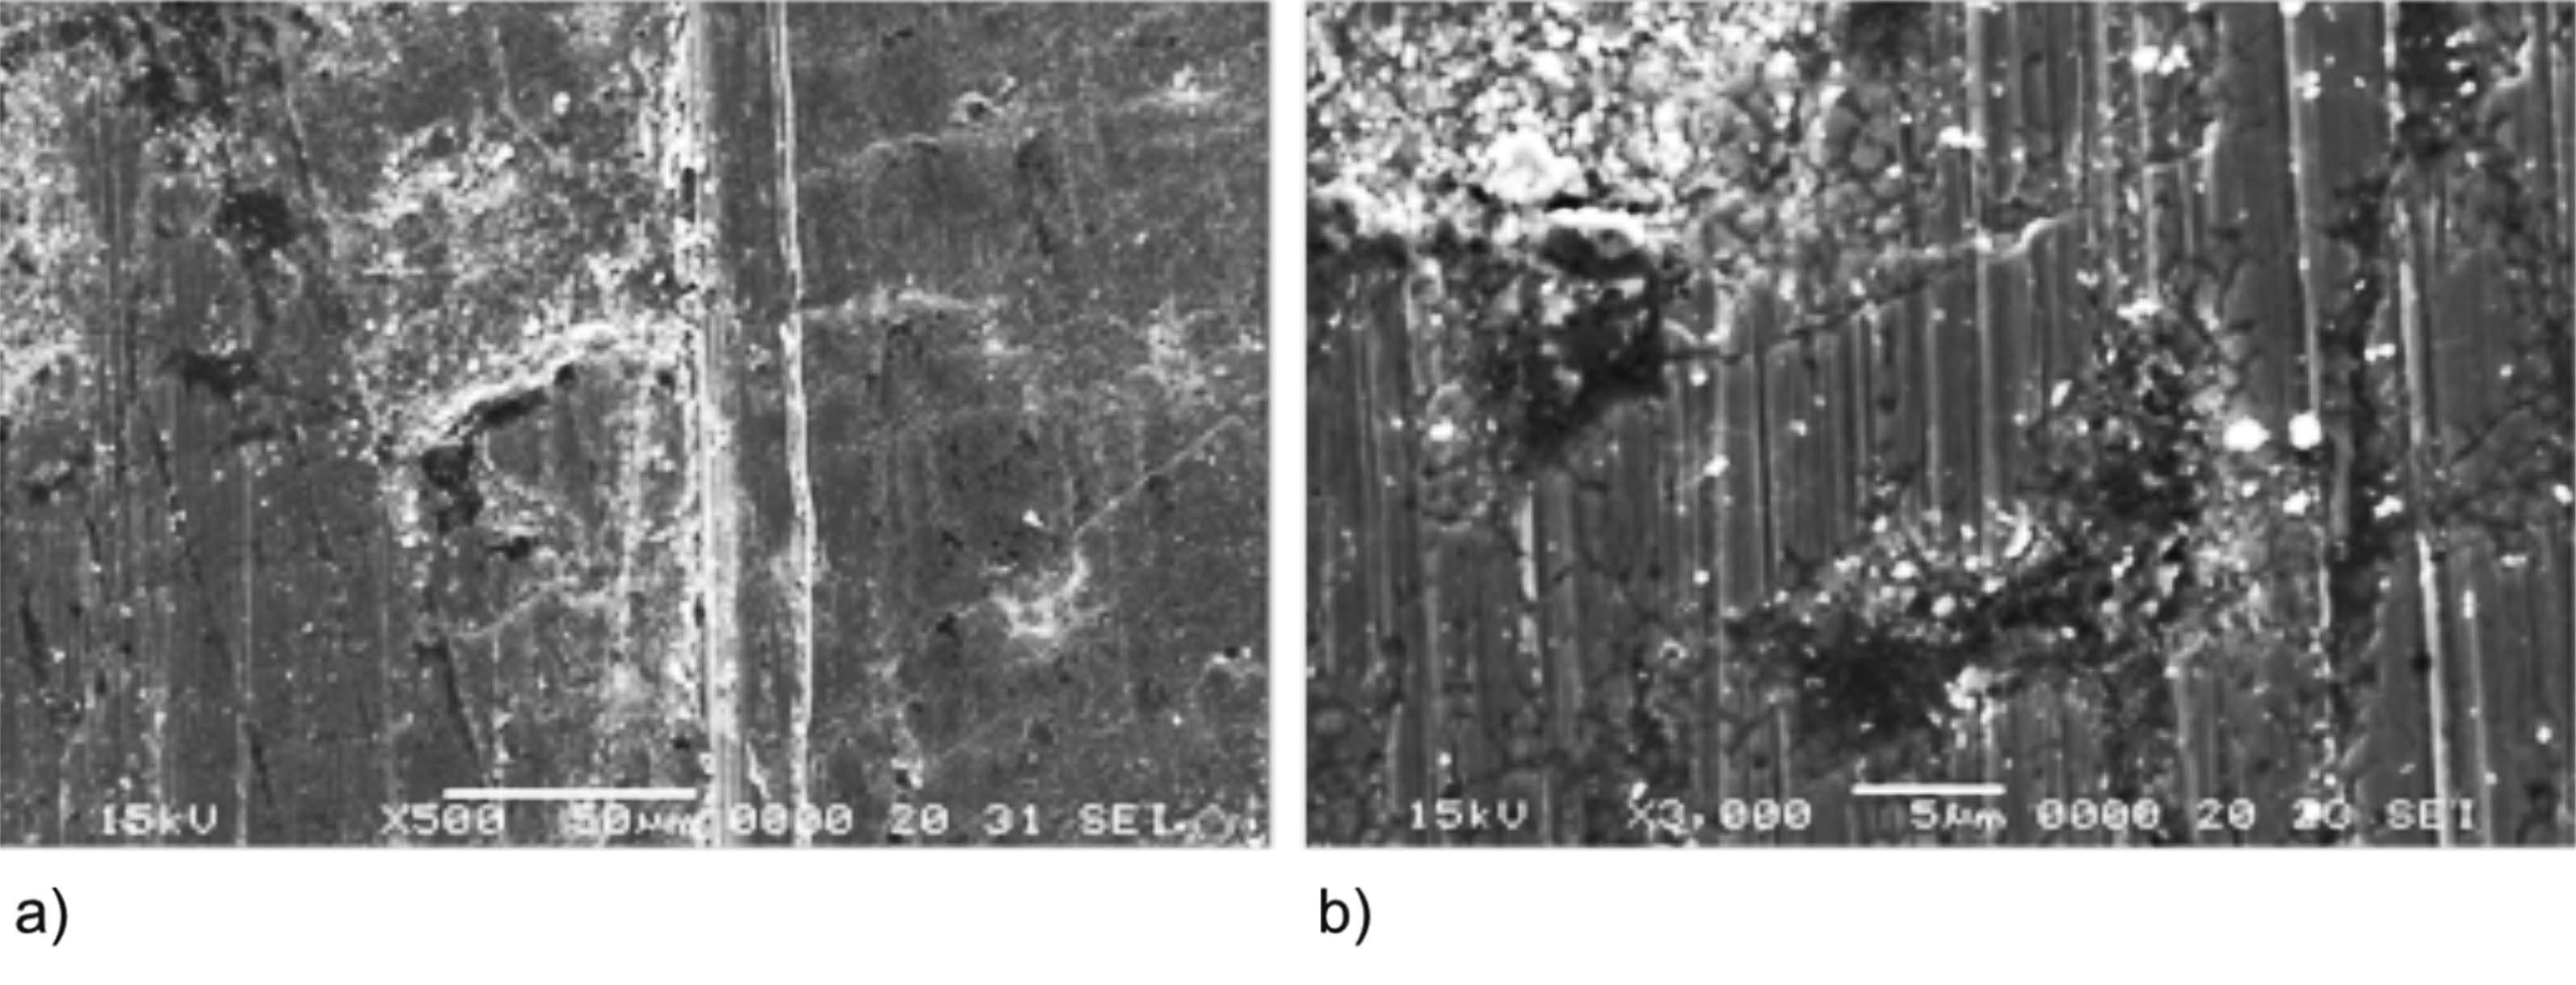
Fig. 8: SEM images of SiO2+BN+Zn-Ni+f sample: a) corrosion and tribocorrosion; b) tribocorrosion
In the case of the Zn-Ni sample (Fig. 6), zinc-nickel coating plastic deformation, surface smoothing, and layer abrasions were visible (caused by wear debris, in areas where zinc was removed from the substrate) – processes that led to a negative potential shift. In the case of the SiO2+Zn-Ni+bp+f sample (Fig. 7), surface smoothing, layer microcracks and material removal from the substrate were visible. However, the areas where the material was removed from the substrate were fewer and there were no layer scratches. In the case of the SiO2+BN+Zn-Ni+f sample (Fig. 8), surface smoothing and slight material removal without substrate exposure were visible. We can conclude that the SiO2+BN+Zn-Ni+f sample had the best tribocorrosion resistance. The SiO2+Zn-Ni+bp+f sample, although it had shown layer microcracks, it had lesser substrate areas exposed to corrosive environment, which was also confirmed by the OCP test versus Zn-Ni sample potential test. Thus, the SiO2+Zn-Ni+bp+f sample was found to have a higher tribocorrosion resistance compared to the Zn-Ni sample.
3.3 Chrono-amperometry results
The current density variation is shown in Figure 9.
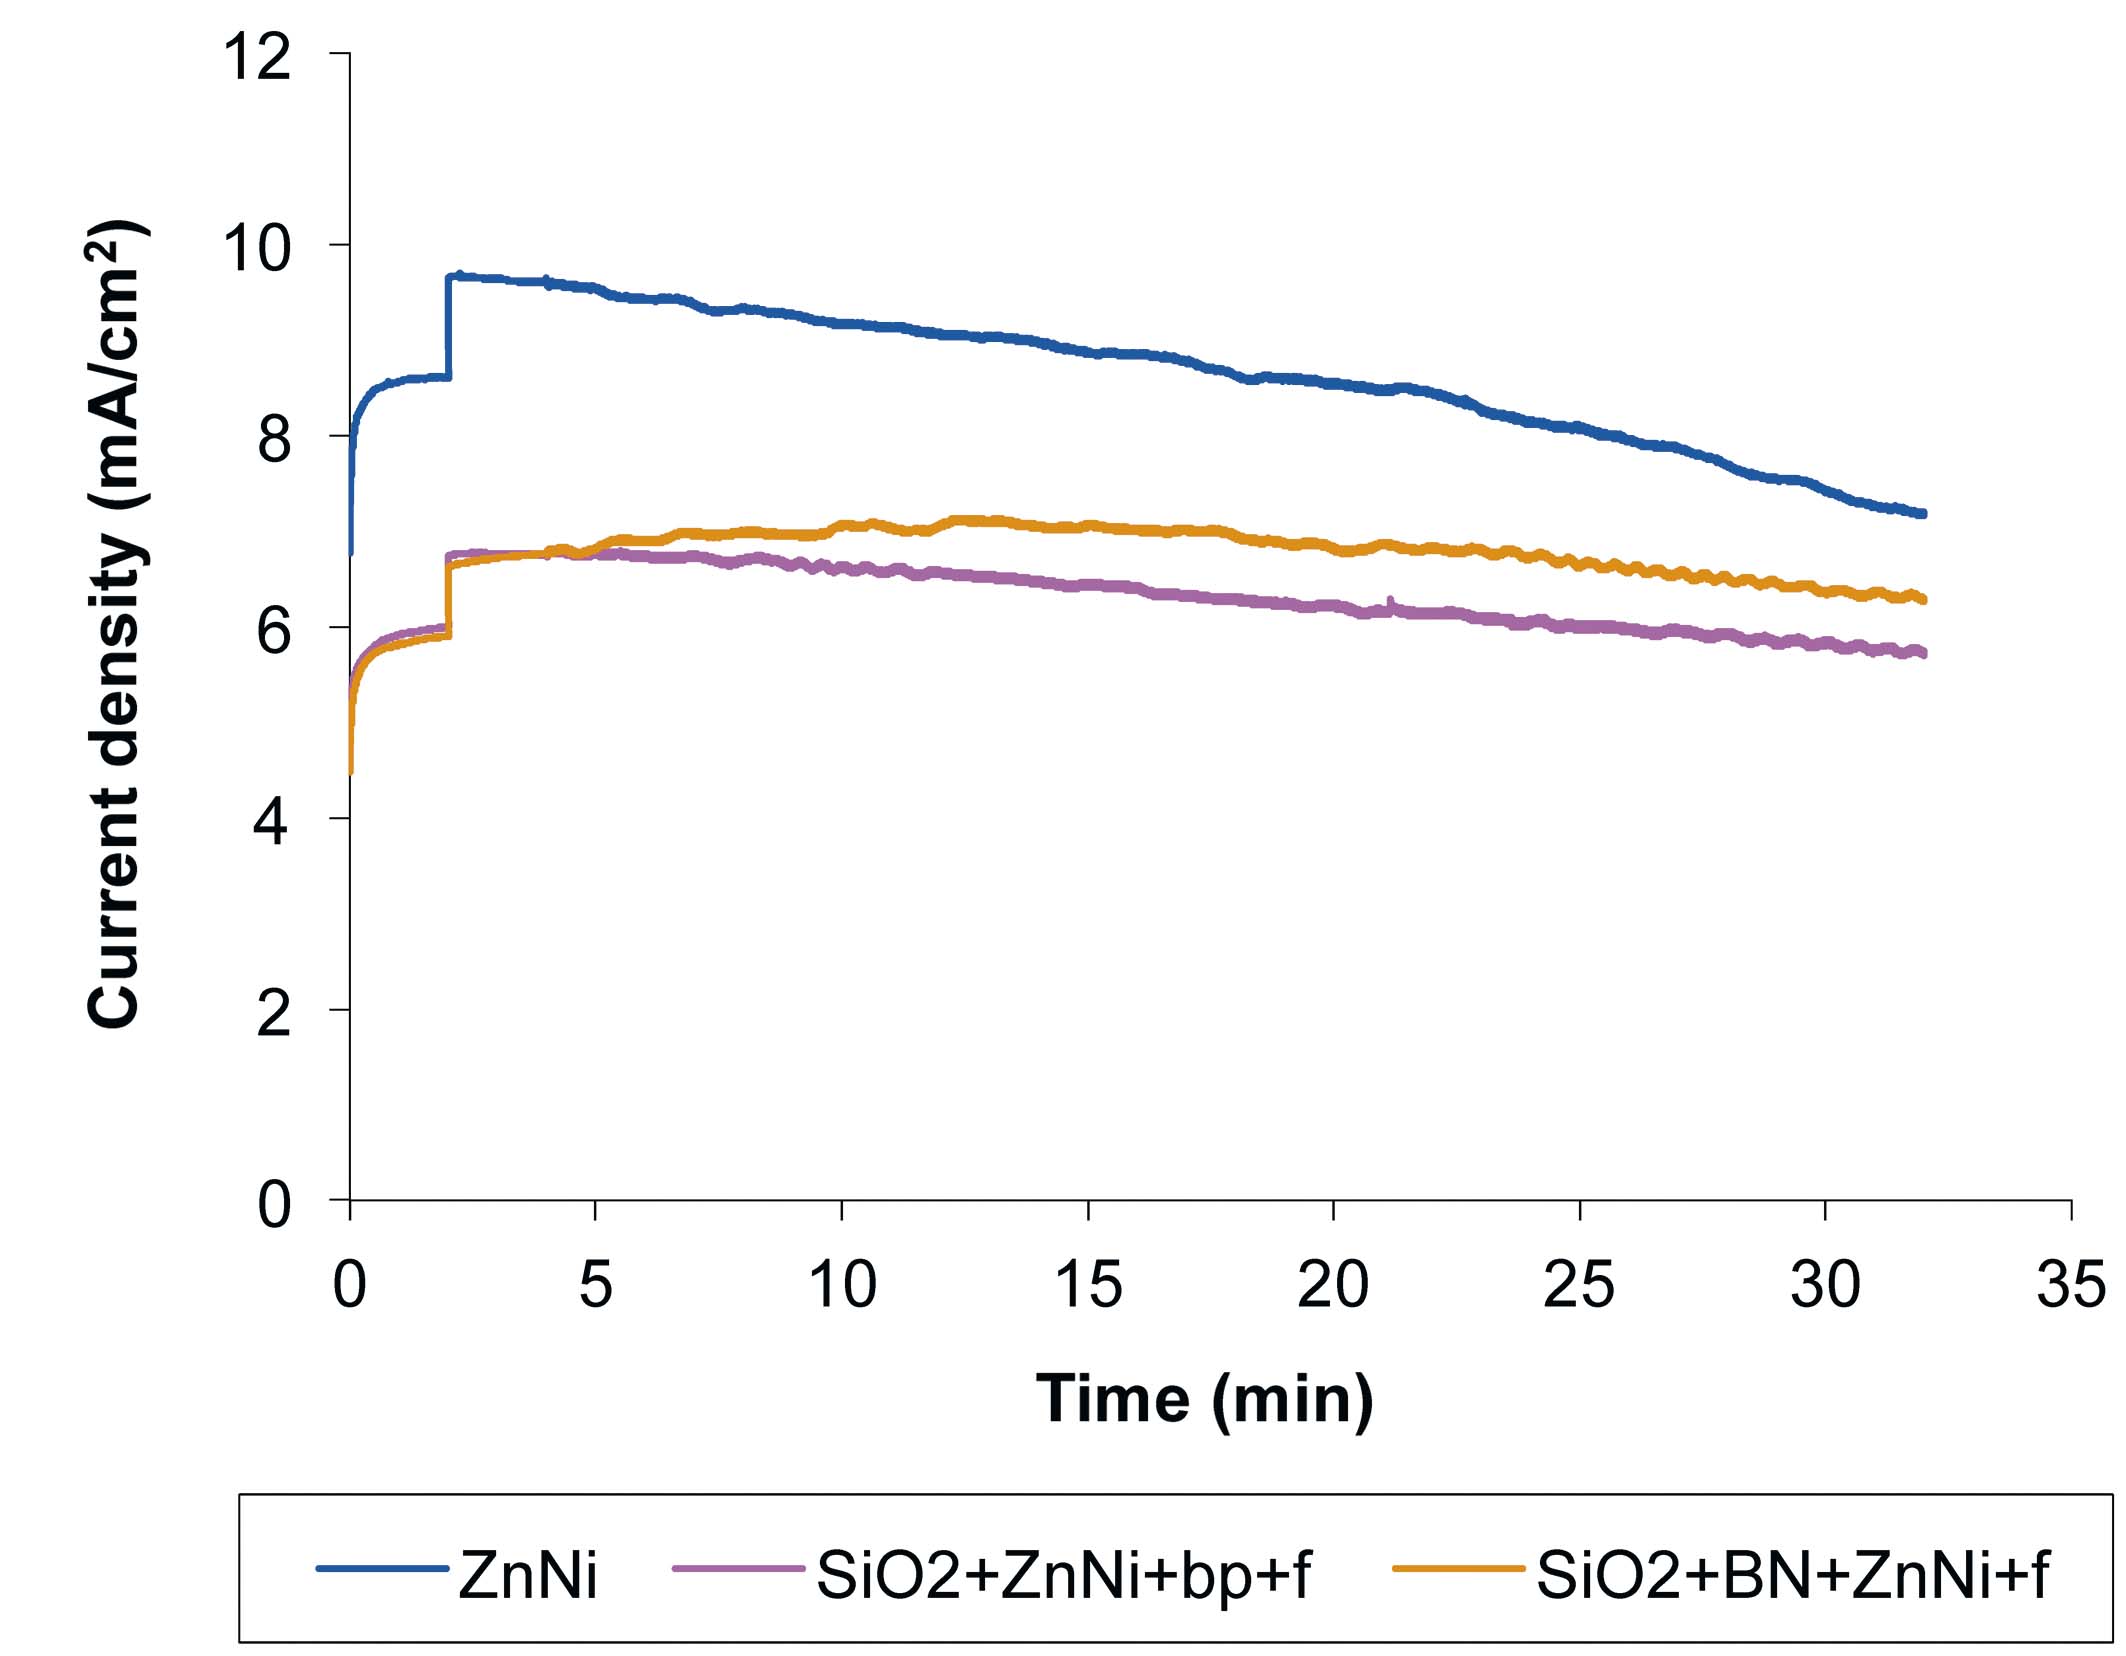
Fig. 9: Current density variation with time, for Zn-Ni, SiO2+Zn-Ni+bp+f and SiO2+BN+Zn-Ni+f samples, during tribocorrosion in 1 % NaCl solution, with the following tribometer parameters: 0.5 Hz, 14 mm, 780 friction cycles and a normal force of 2 N
As seen in Figure 9, the current density decreases slowly, due to slow electron transfer toward the oxidizing species, leading to surface passivation. The current density decrease during friction was 2.34 mA/cm2 for the Zn-Ni sample, 0.32 mA/cm2 for the SiO2+Zn-Ni+bp+f sample and of 0.94 mA/cm2 for the SiO2+BN+Zn-Ni+f sample. Even though the current density decrease was stronger for the Zn-Ni sample, the current density value (3 mA/cm2) was higher compared to the other samples. Thus, the surface passivation was faster, but the amount of dissolved layer was higher. For the other samples, although the decrease in current density was lower (thus a lower passivation rate), the current density value was also low (thus, a lesser dissolved layer). Therefore, SiO2+BN+Zn-Ni+f and SiO2+Zn-Ni+bp+f samples are more resistant to combined mechanical and chemical factors, when compared to the Zn-Ni sample.
3.4 Corrosion products
The corrosion products formed on the surface of the Zn-Ni coated sample were analyzed by using X-ray method.
According to the corrosion products diffractograms analysis (Fig. 10), and to Table 6 data, nickel oxide formed on all samples. The nickel oxide crystallographic preferential growing direction was (200) for SiO2+Zn-Ni+bp+f and SiO2+BN+Zn-Ni+f samples, and (220) for the Zn-Ni sample.
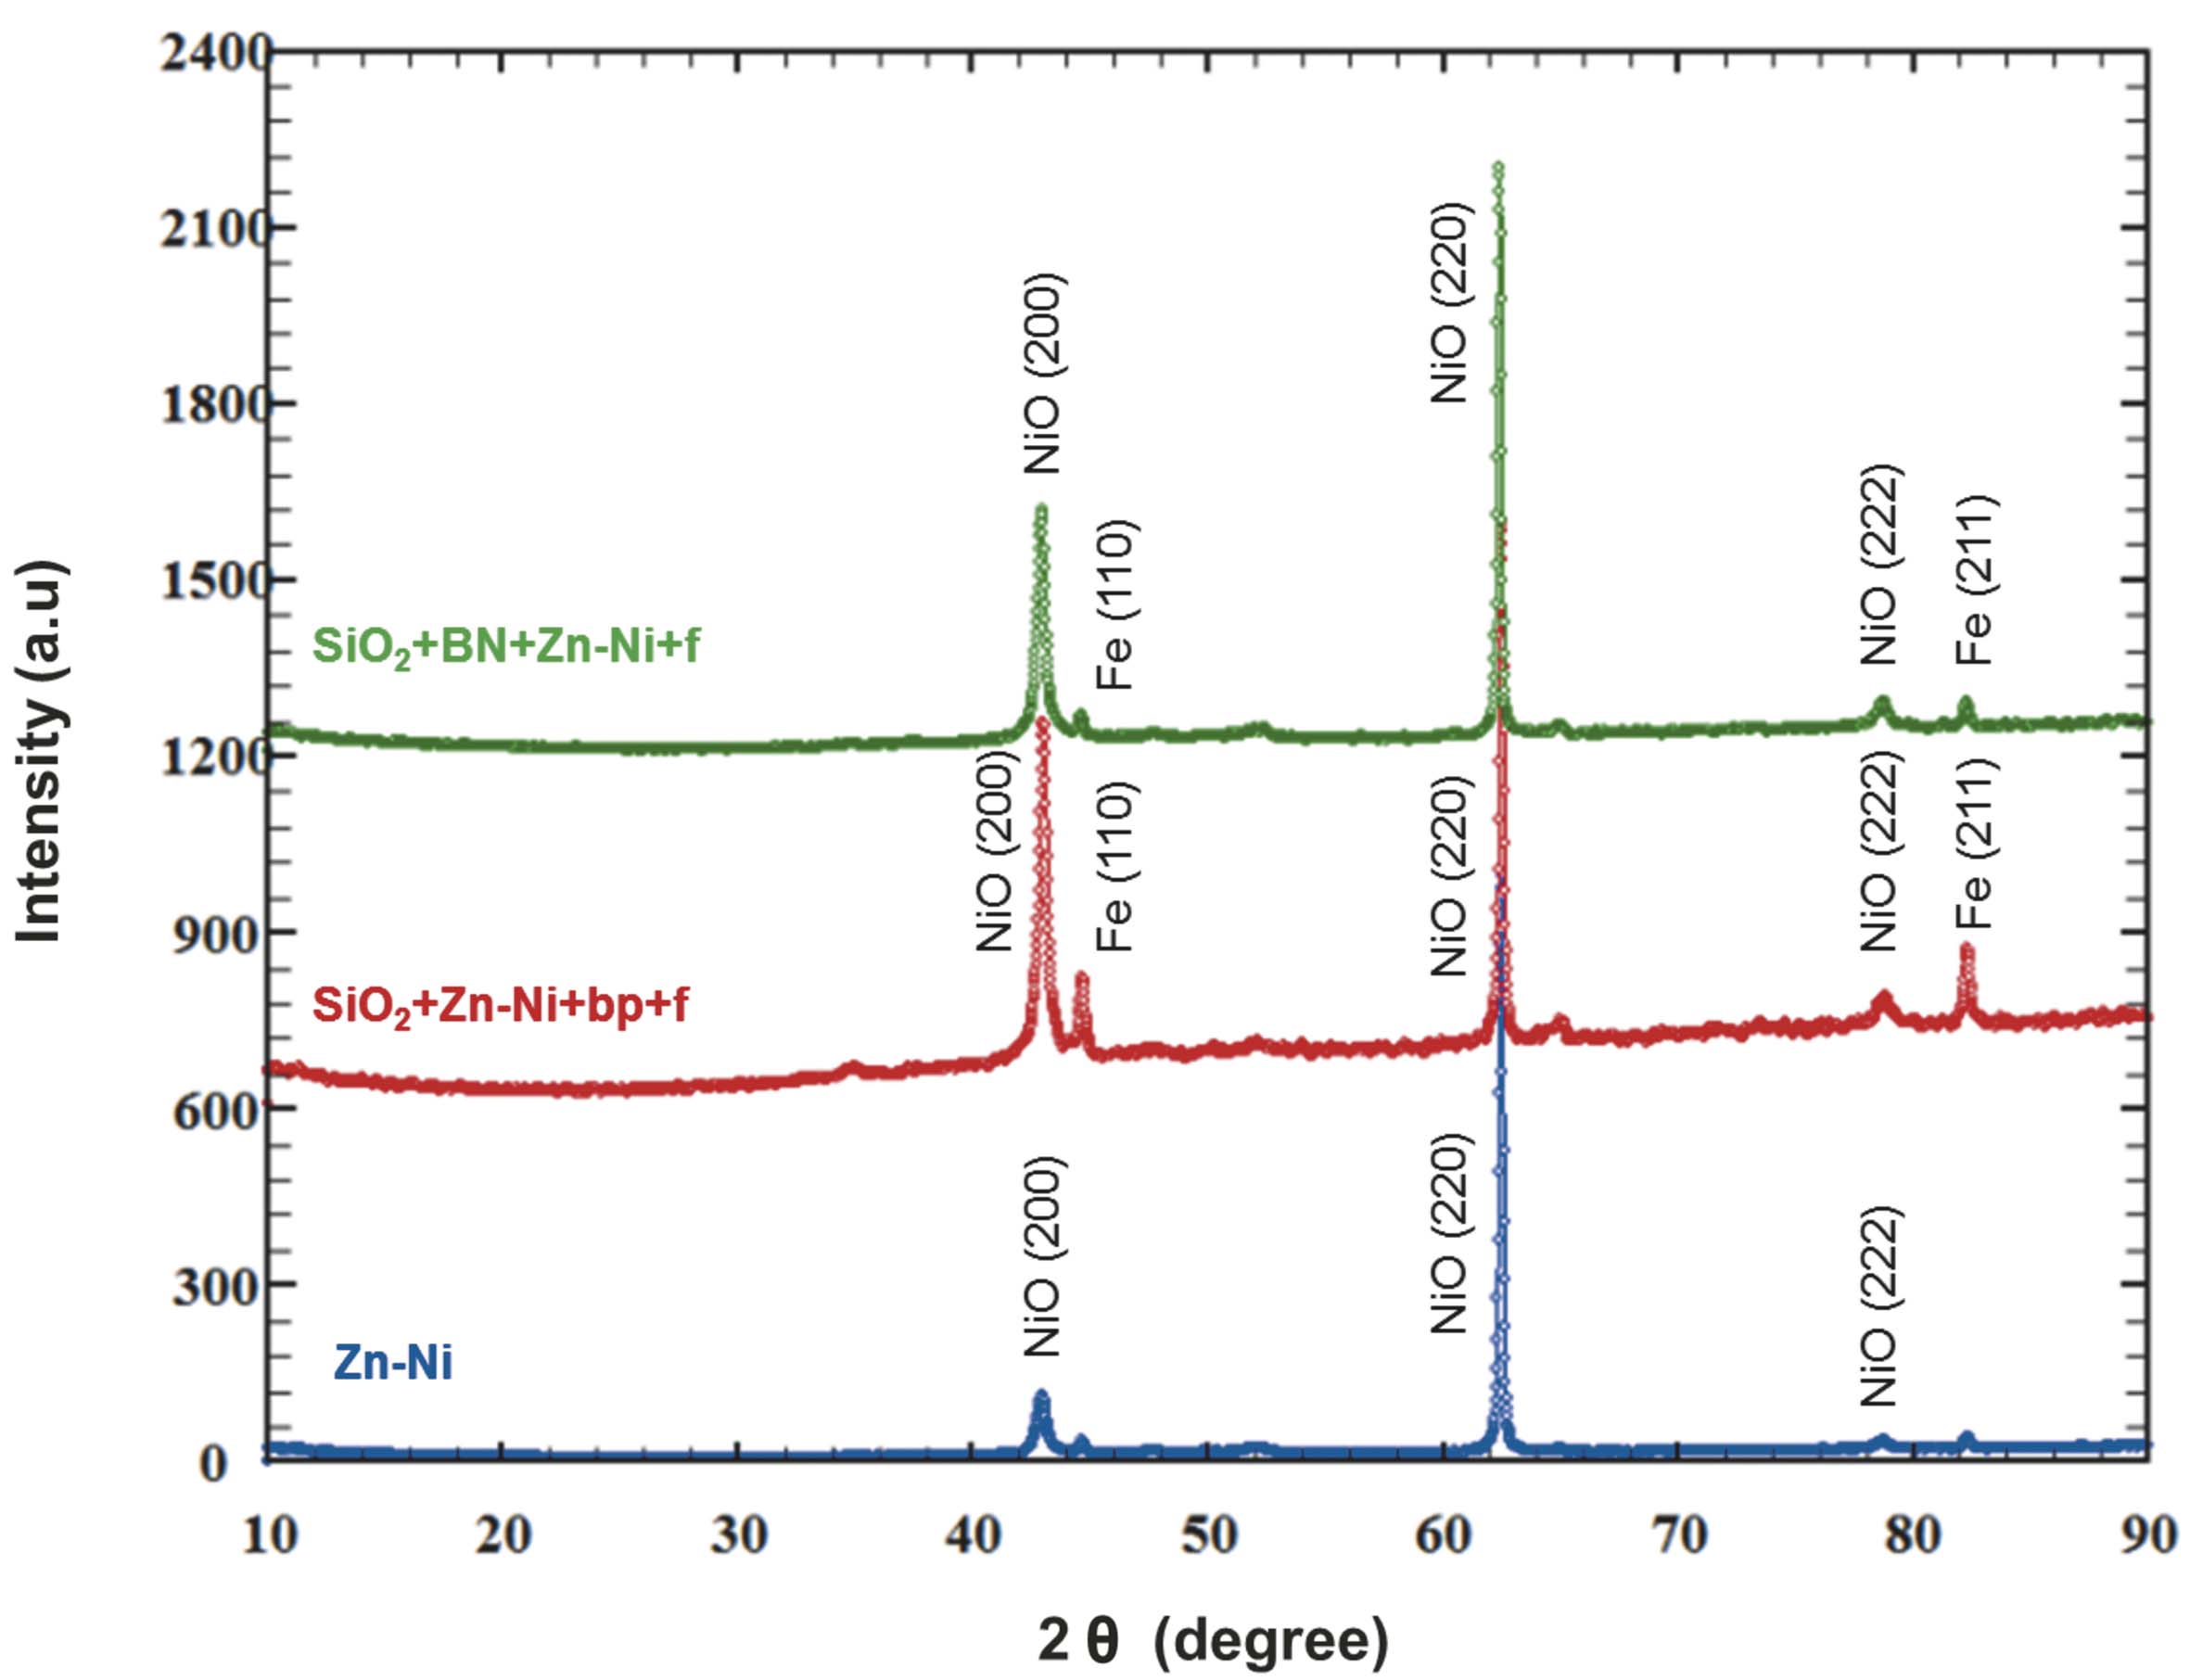
Fig. 10: Corrosion products diffraction spectra
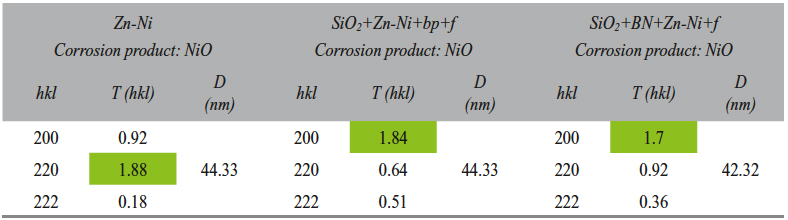
Tab. 6: Corrosion products preferential crystallographic orientation and crystallites size
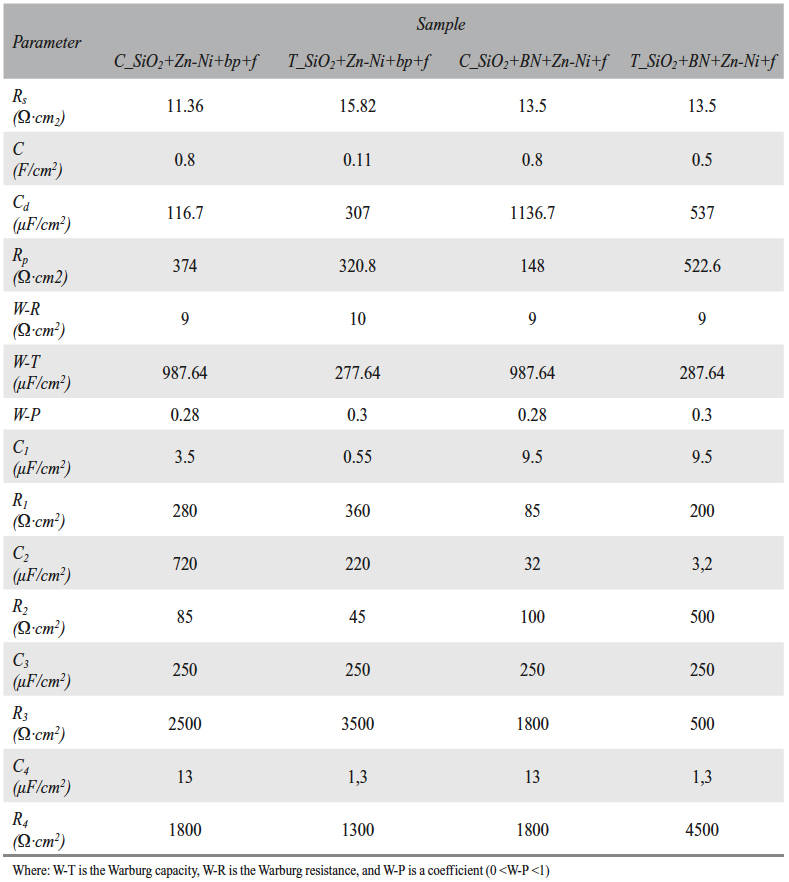
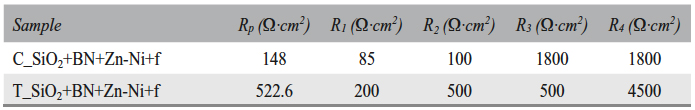
Tab. 7: The circuit elements values for the SiO2+Zn-Ni+bp+f and SiO2+BN+Zn-Ni+f samples, before (C_) and after (T_) the wear test
3.5 Electrochemical impedance spectroscopy results
The Nyquist diagrams plotted before the wear test (marked with C_) and after the wear test (marked with T_), for the Zn-Ni alloy electrode posited on SiO2+BN+Zn-Ni+f and on SiO2+Zn-Ni+bp+f samples, are shown in Figure 11.
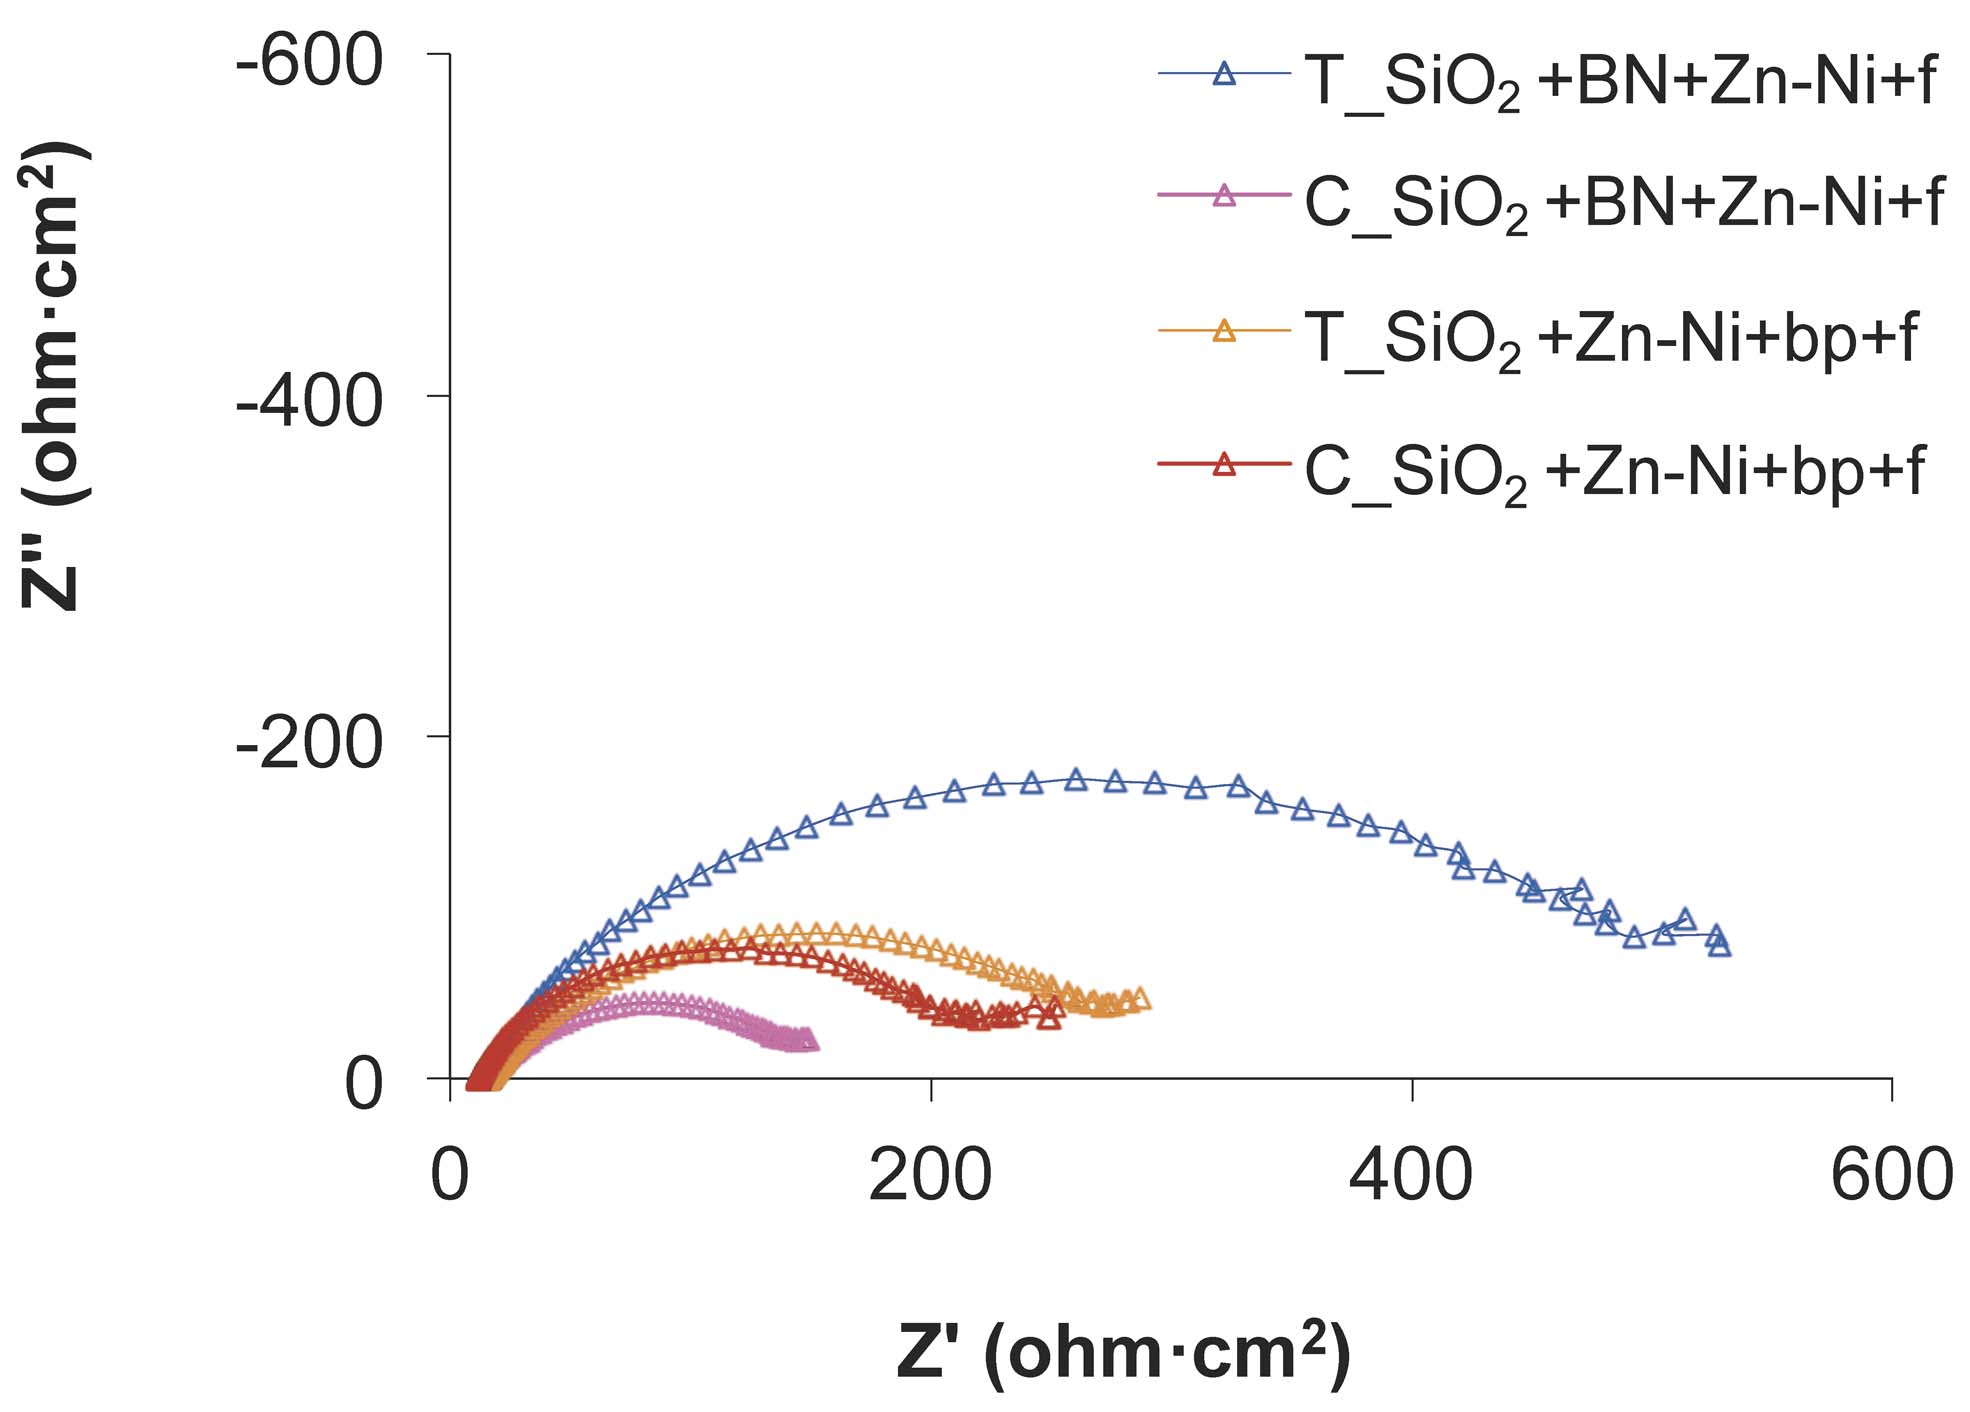
Fig. 11: Nyquist diagrams for SiO2+BN+Zn-Ni+bp+f and SiO2+Zn-Ni+bp+f samples, before and after the wear test
The shapes of Nyquist impedance spectra for the two samples are similar, showing a loop at high frequencies, followed by a slightly ascending curve at low frequencies. This shows that the corrosion resistance is influenced by charge transfer and by diffusion.
The semi-circle loops show the charge transfer areas. The semi-circles diameters are correlated with the film polarization resistance Rp and correspond to the corrosion rate.
The equivalent circuit corresponding to the electrochemical impedance spectra for SiO2+Zn-Ni+bp+f and SiO2+BN+Zn-Ni+f samples is shown in Figure 12. The equivalent circuit was obtained using specialized software.
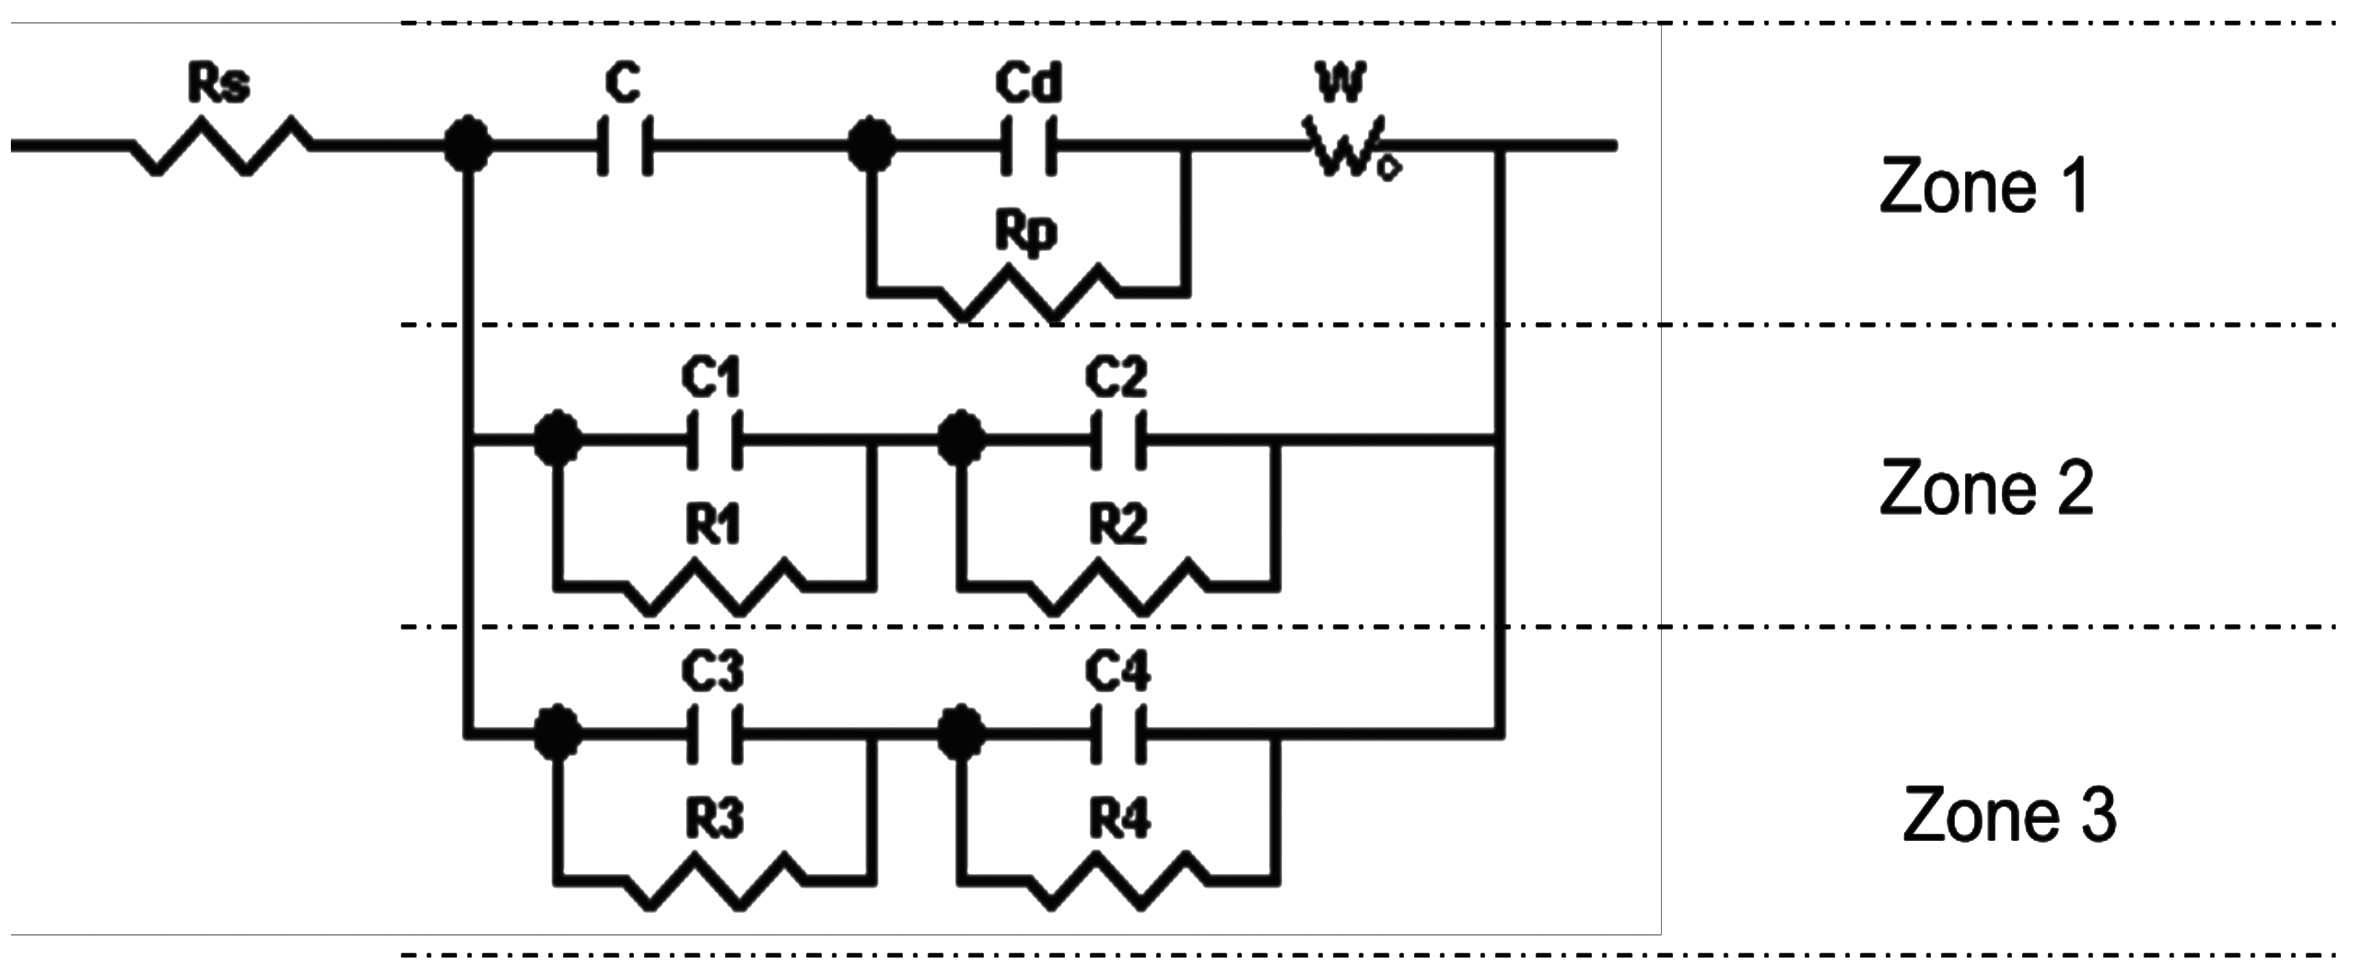
Fig. 12: The equivalent circuit for interpreting the Nyquist diagrams
The plot based on the proposed equivalent circuit model describes accurately the experimental Nyquist diagrams for the two samples with high tribocorrosion resistance, as shown in Figures 13, 14, 15 and 16.
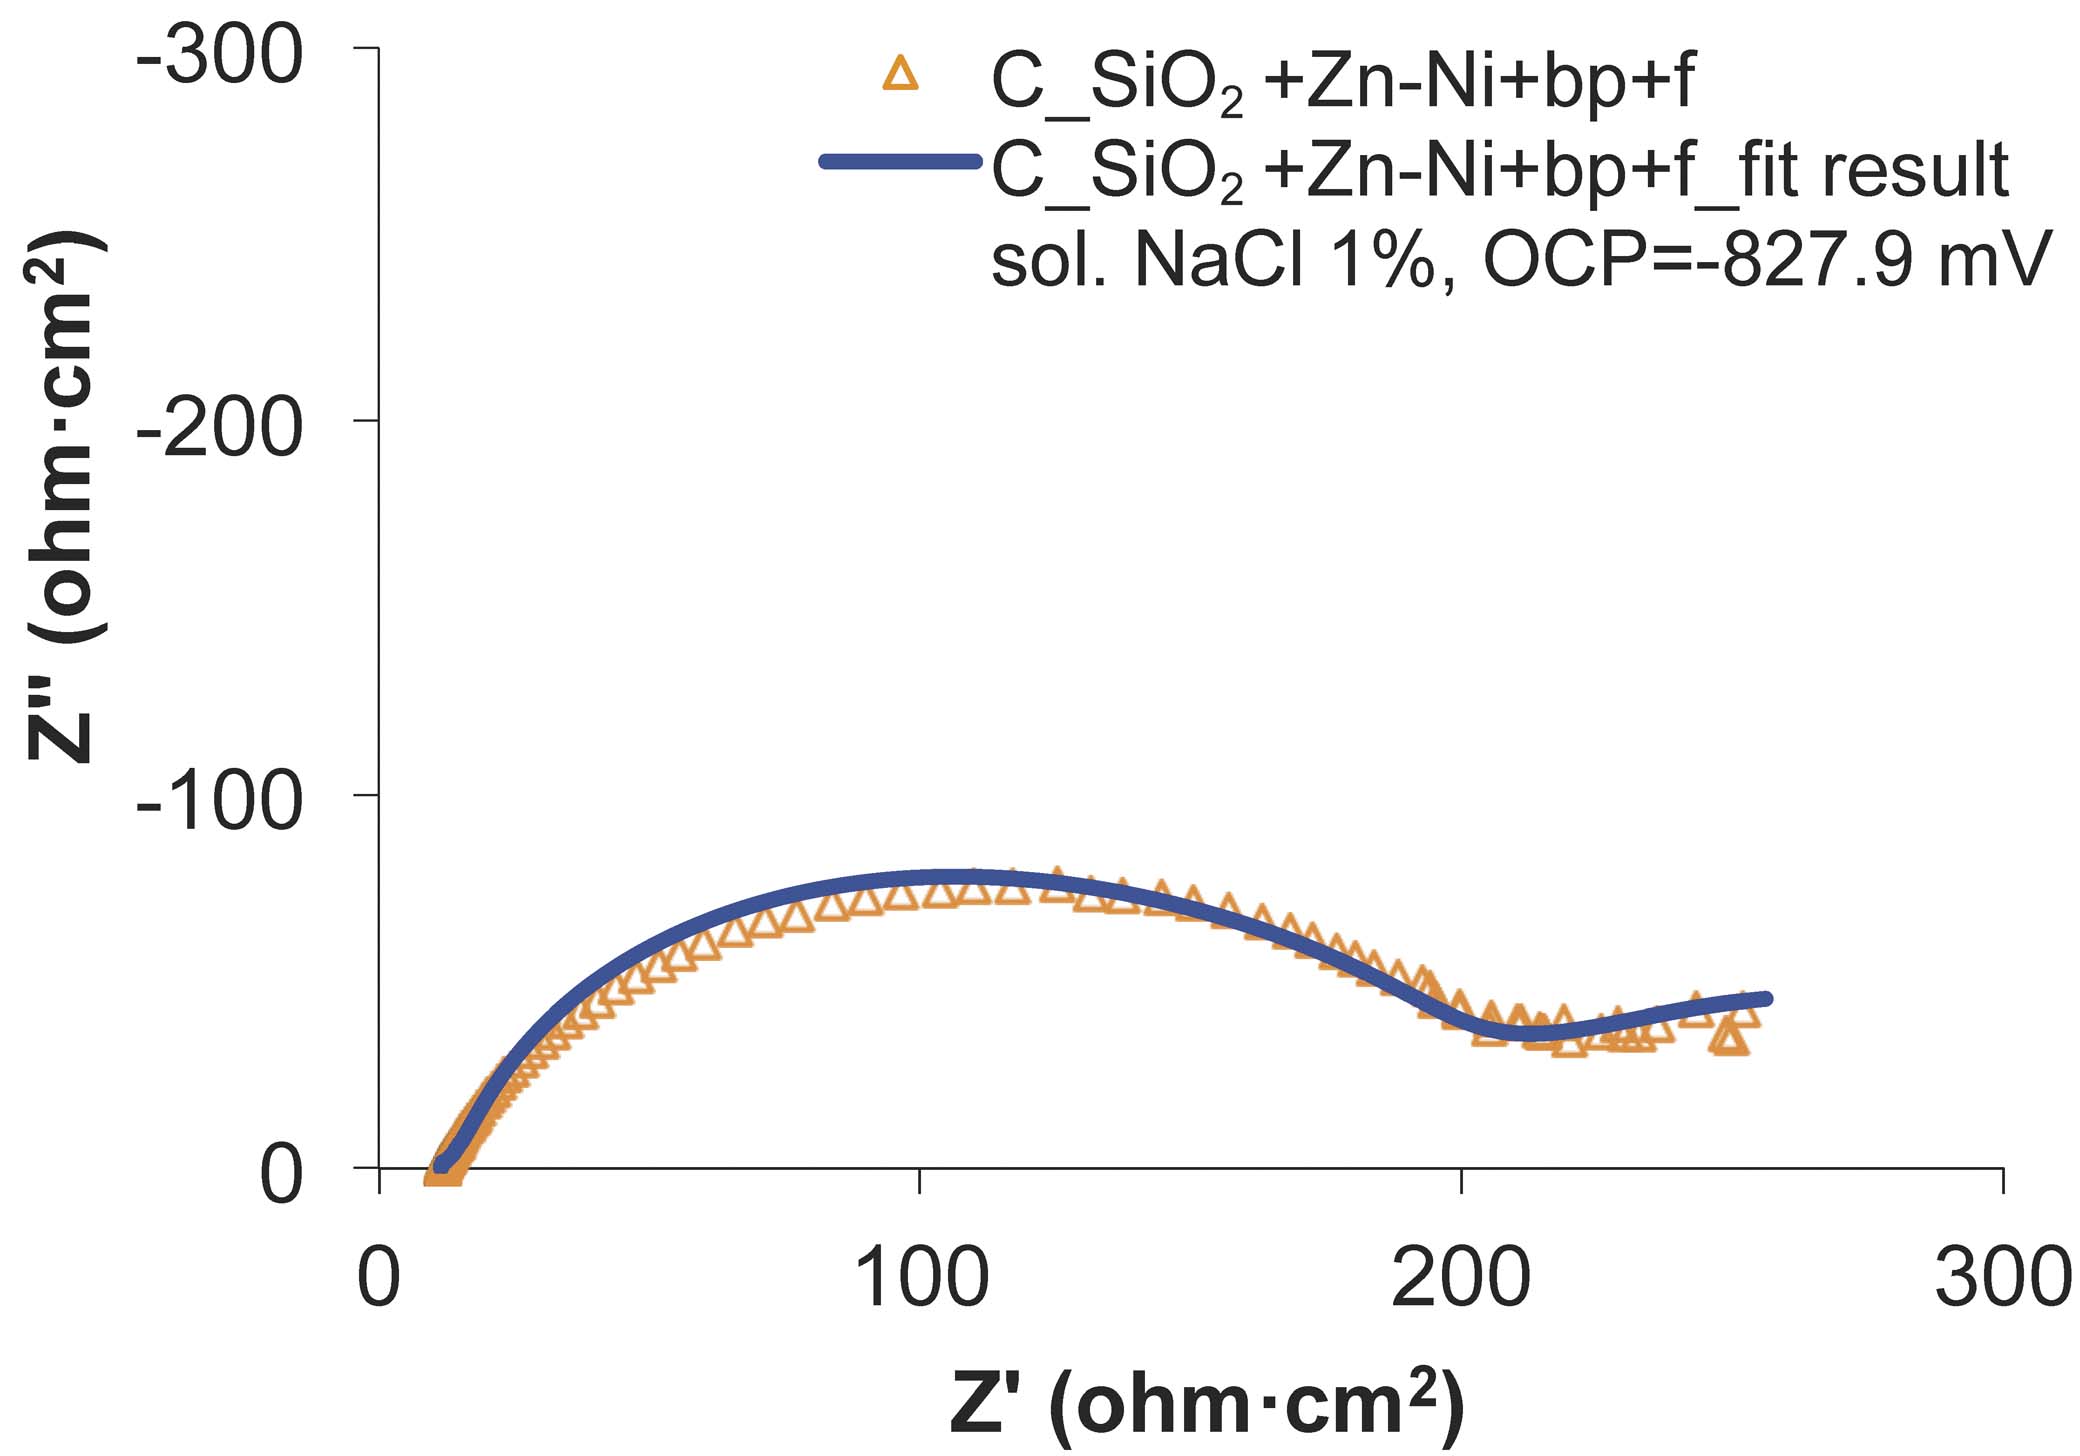
Fig. 13: The experimental and fitted Nyquist diagrams for SiO2+Zn-Ni+bp+f sample, before the wear test
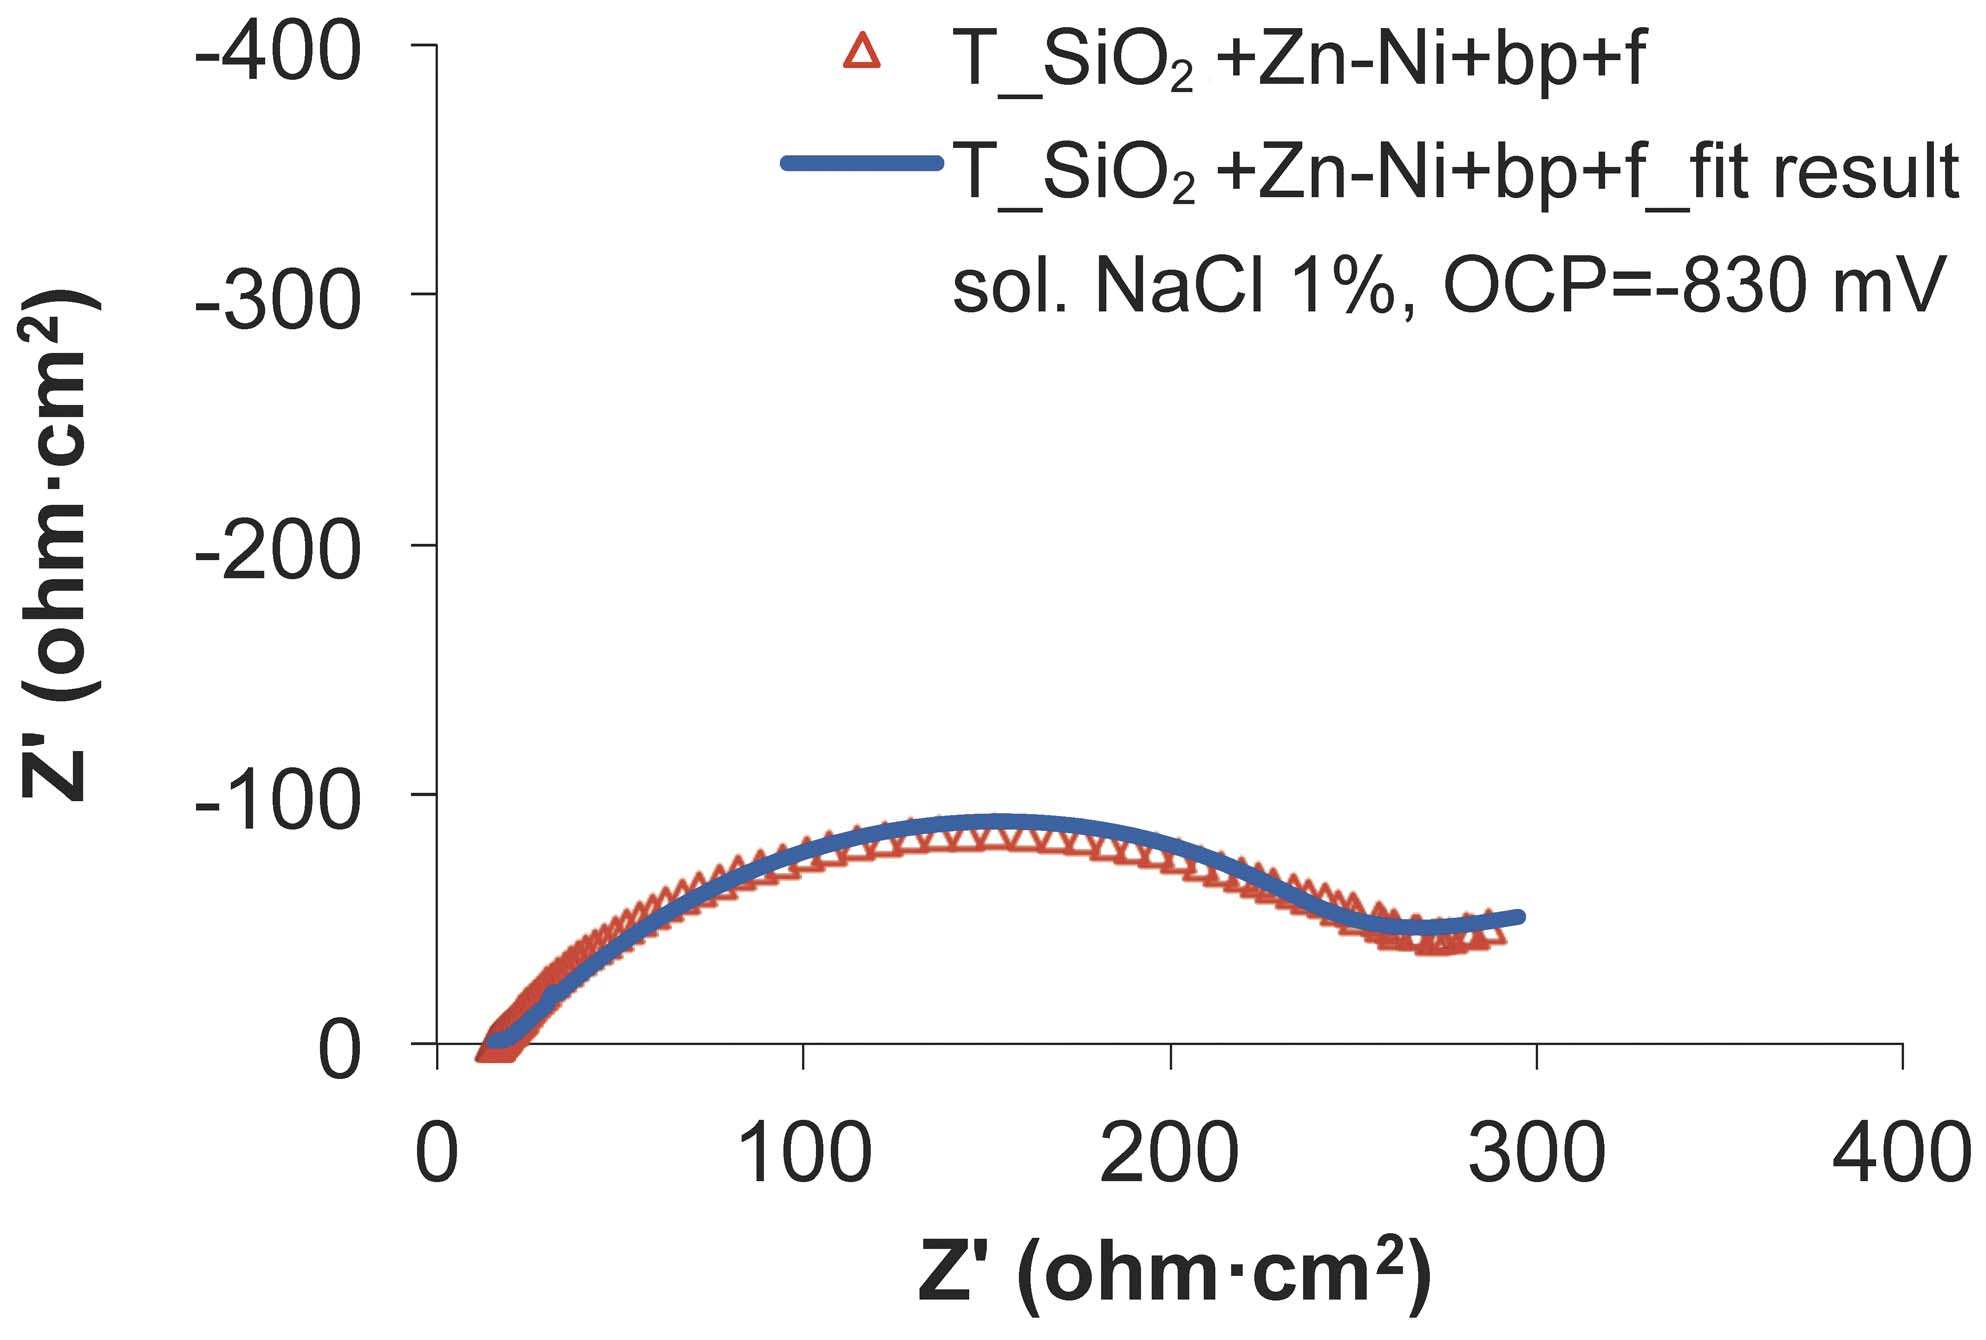
Fig. 14: The experimental and fitted Nyquist diagrams for SiO2+Zn-Ni+bp+f sample, after the wear test
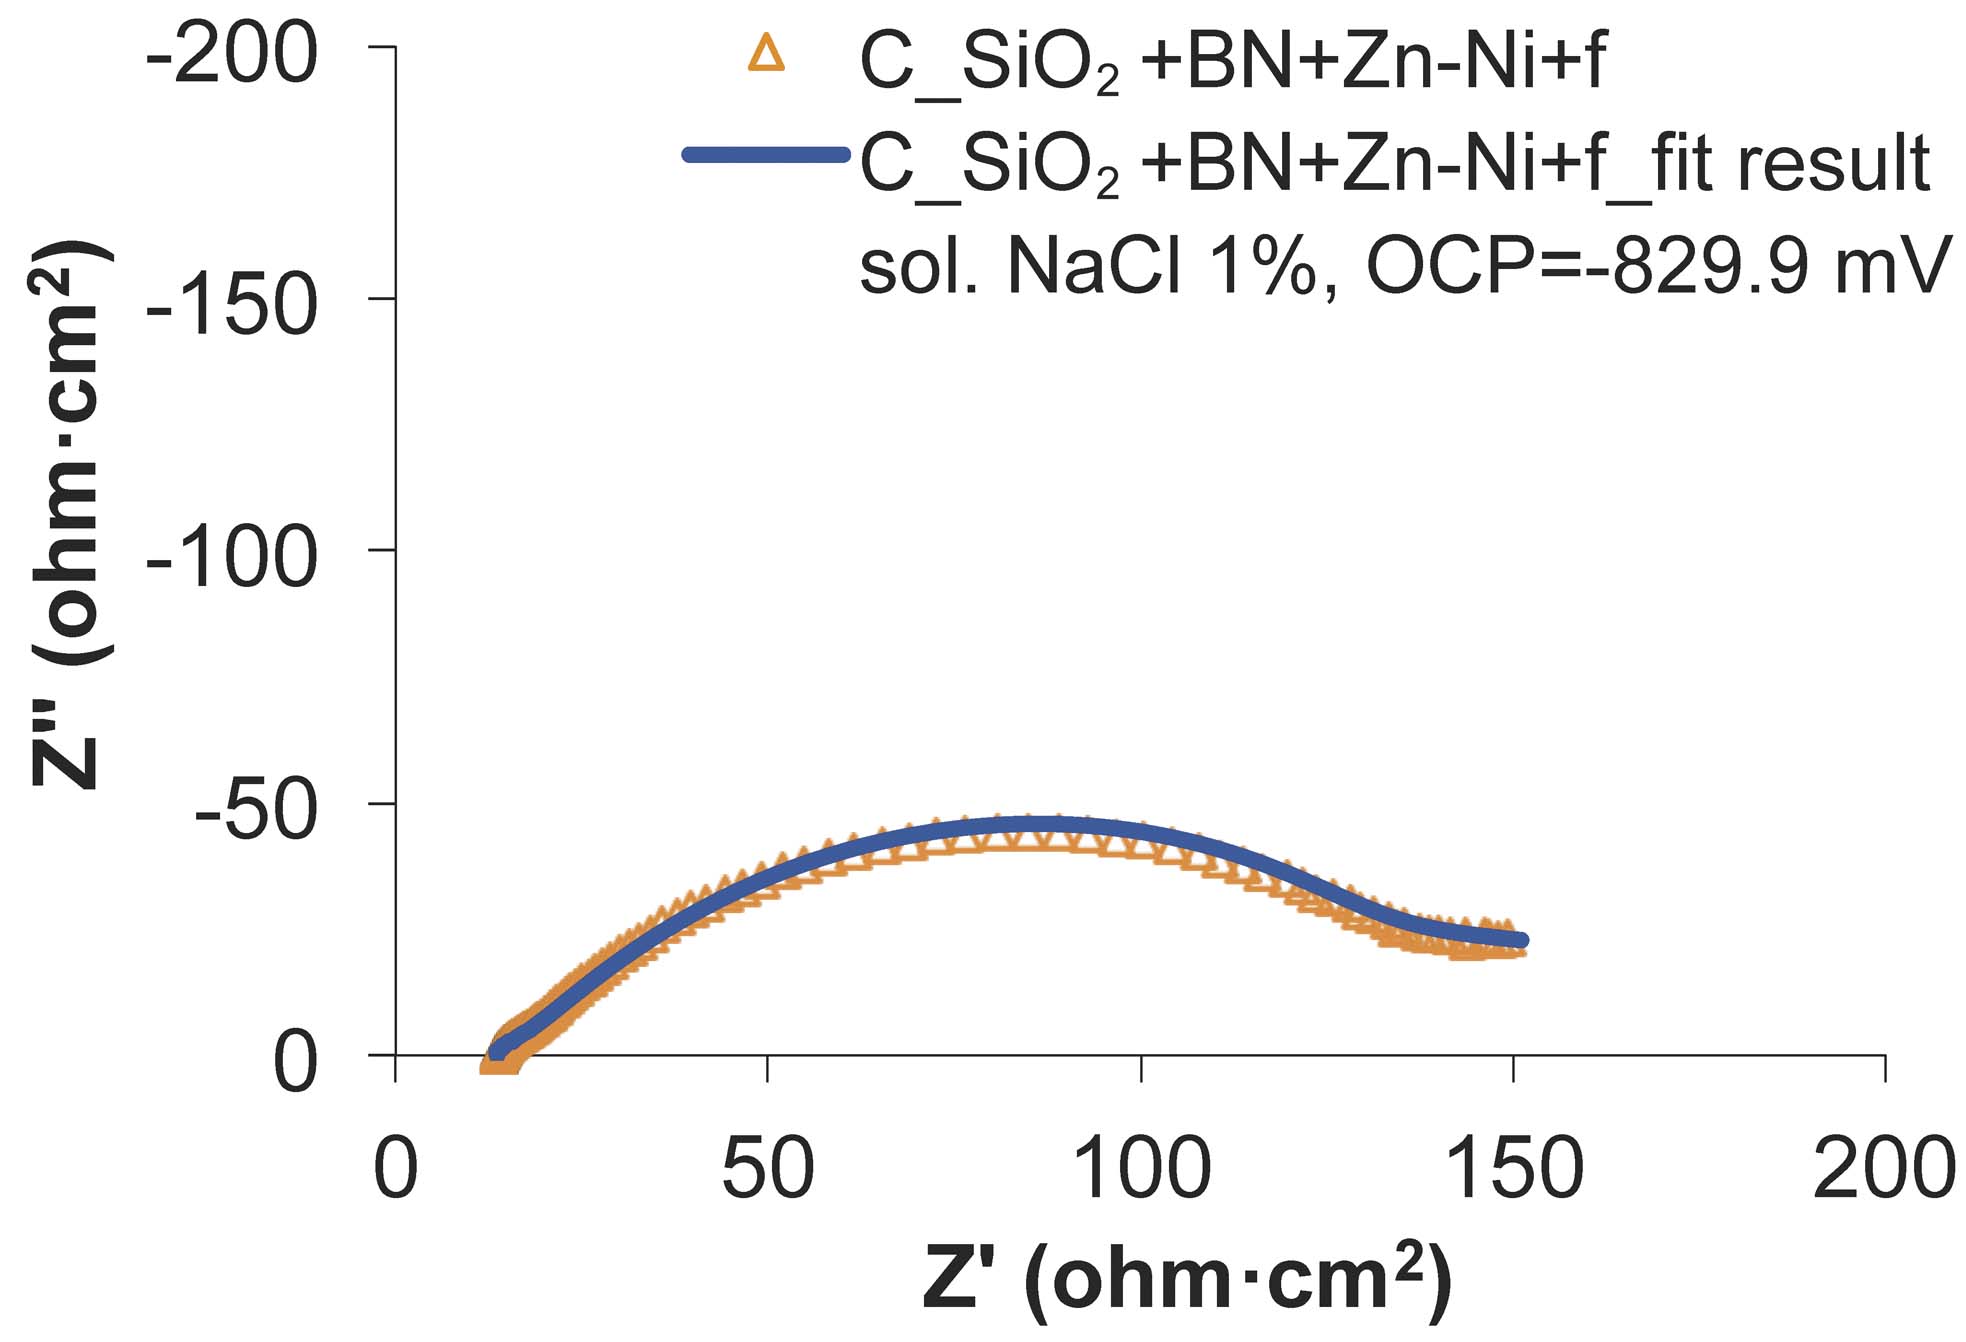
Fig. 15: The experimental and fitted Nyquist diagrams for SiO2+BN+Zn-Ni+f sample, before the wear test
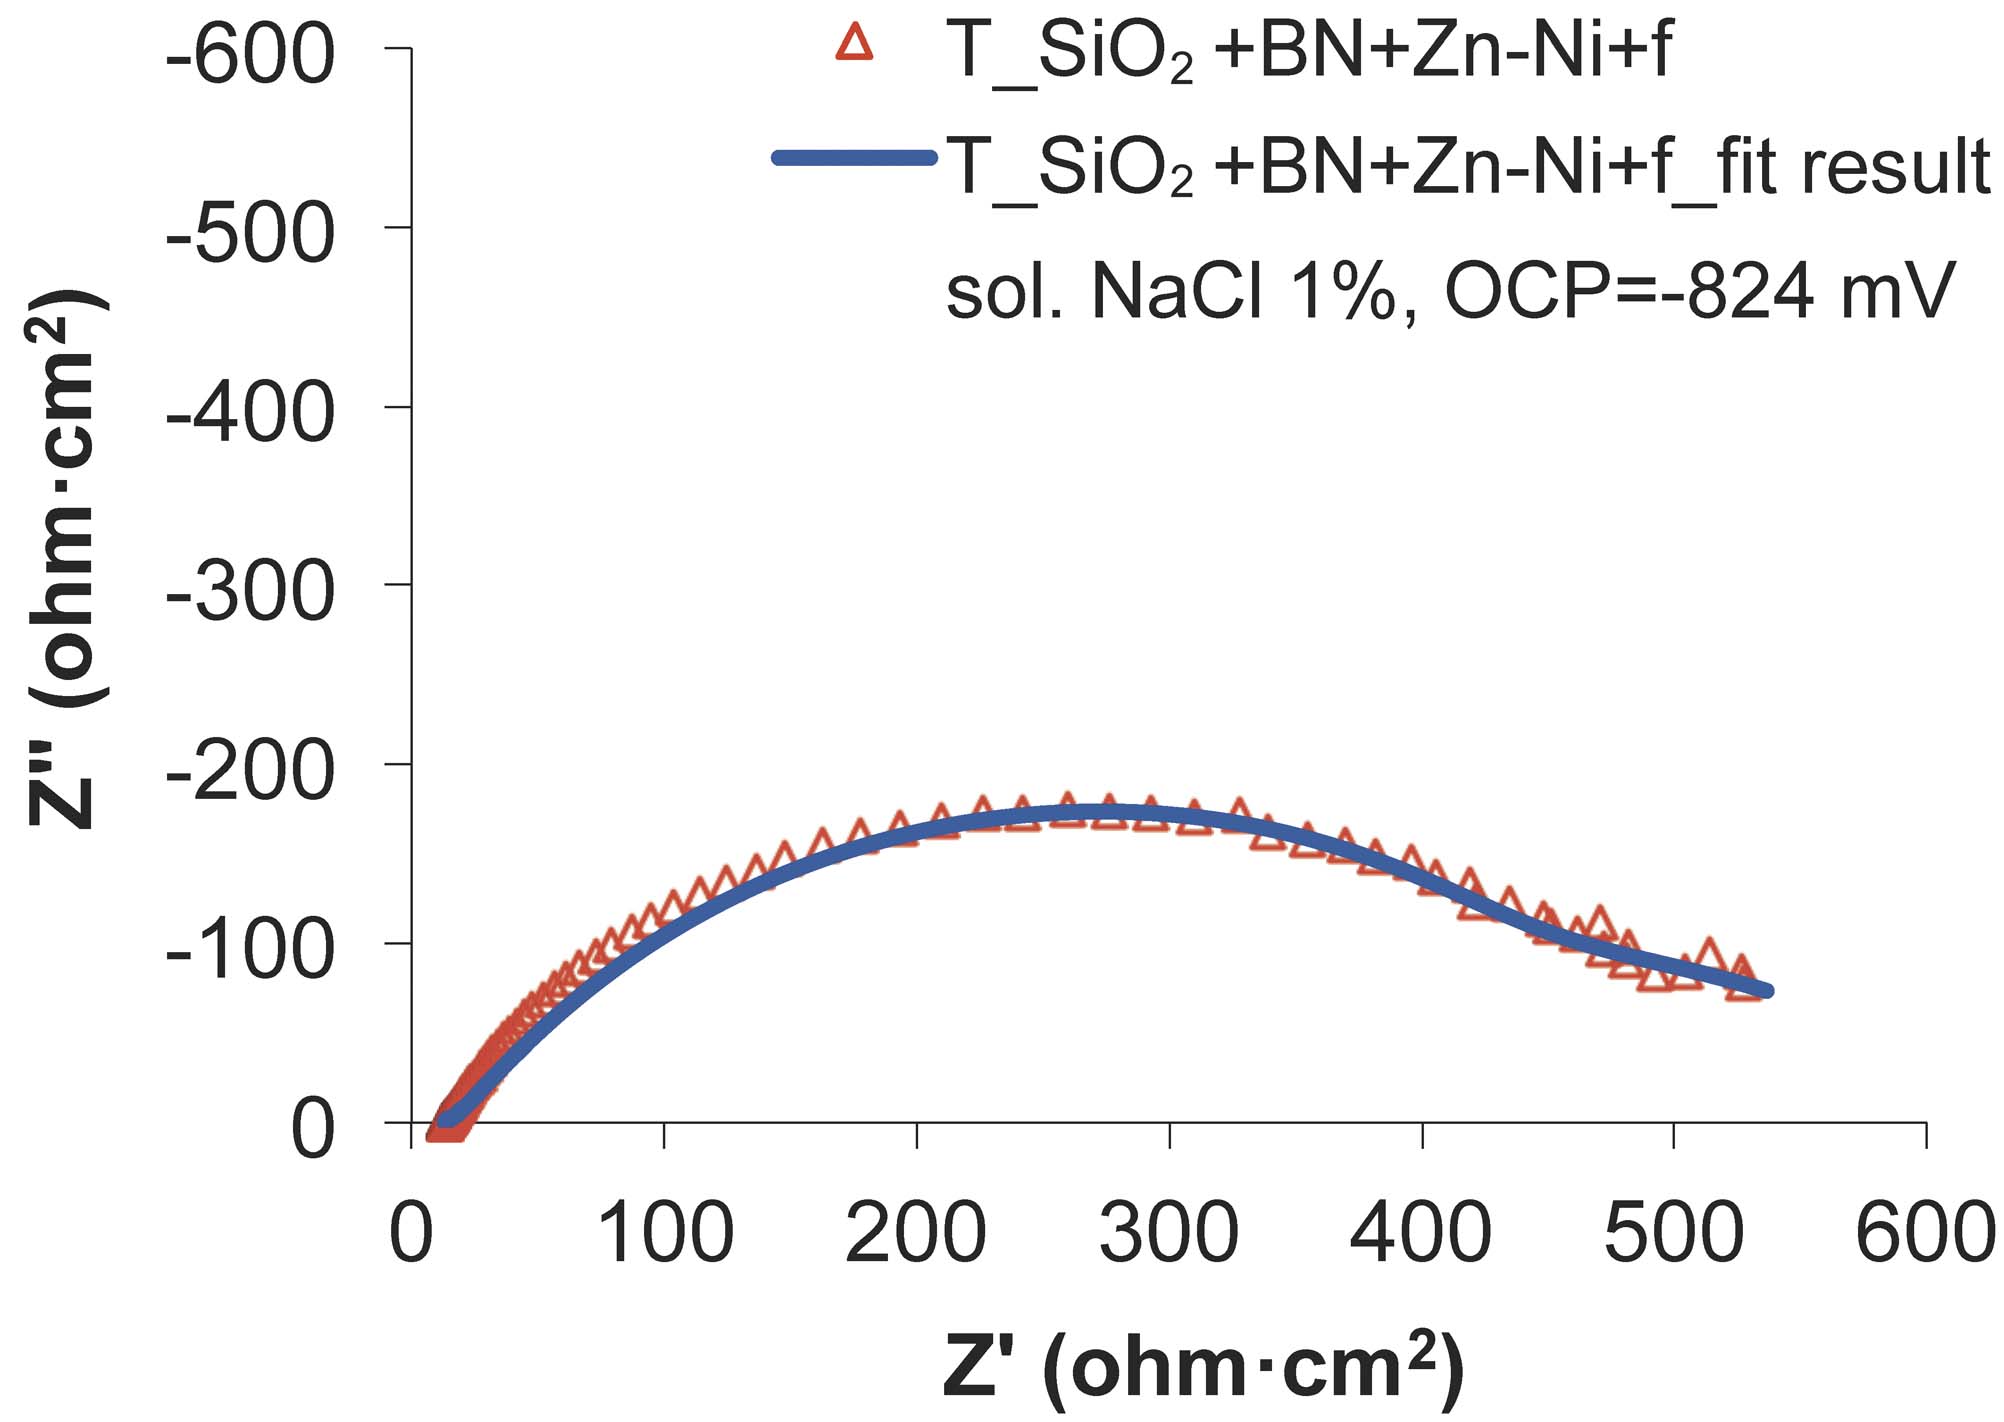
Fig. 16: The experimental and fitted Nyquist diagrams for SiO2+BN+Zn-Ni+f sample, after the wear test
There are three zones randomly distributed on the sample surface, corresponding to the three sides of the circuit, showing different behavior.
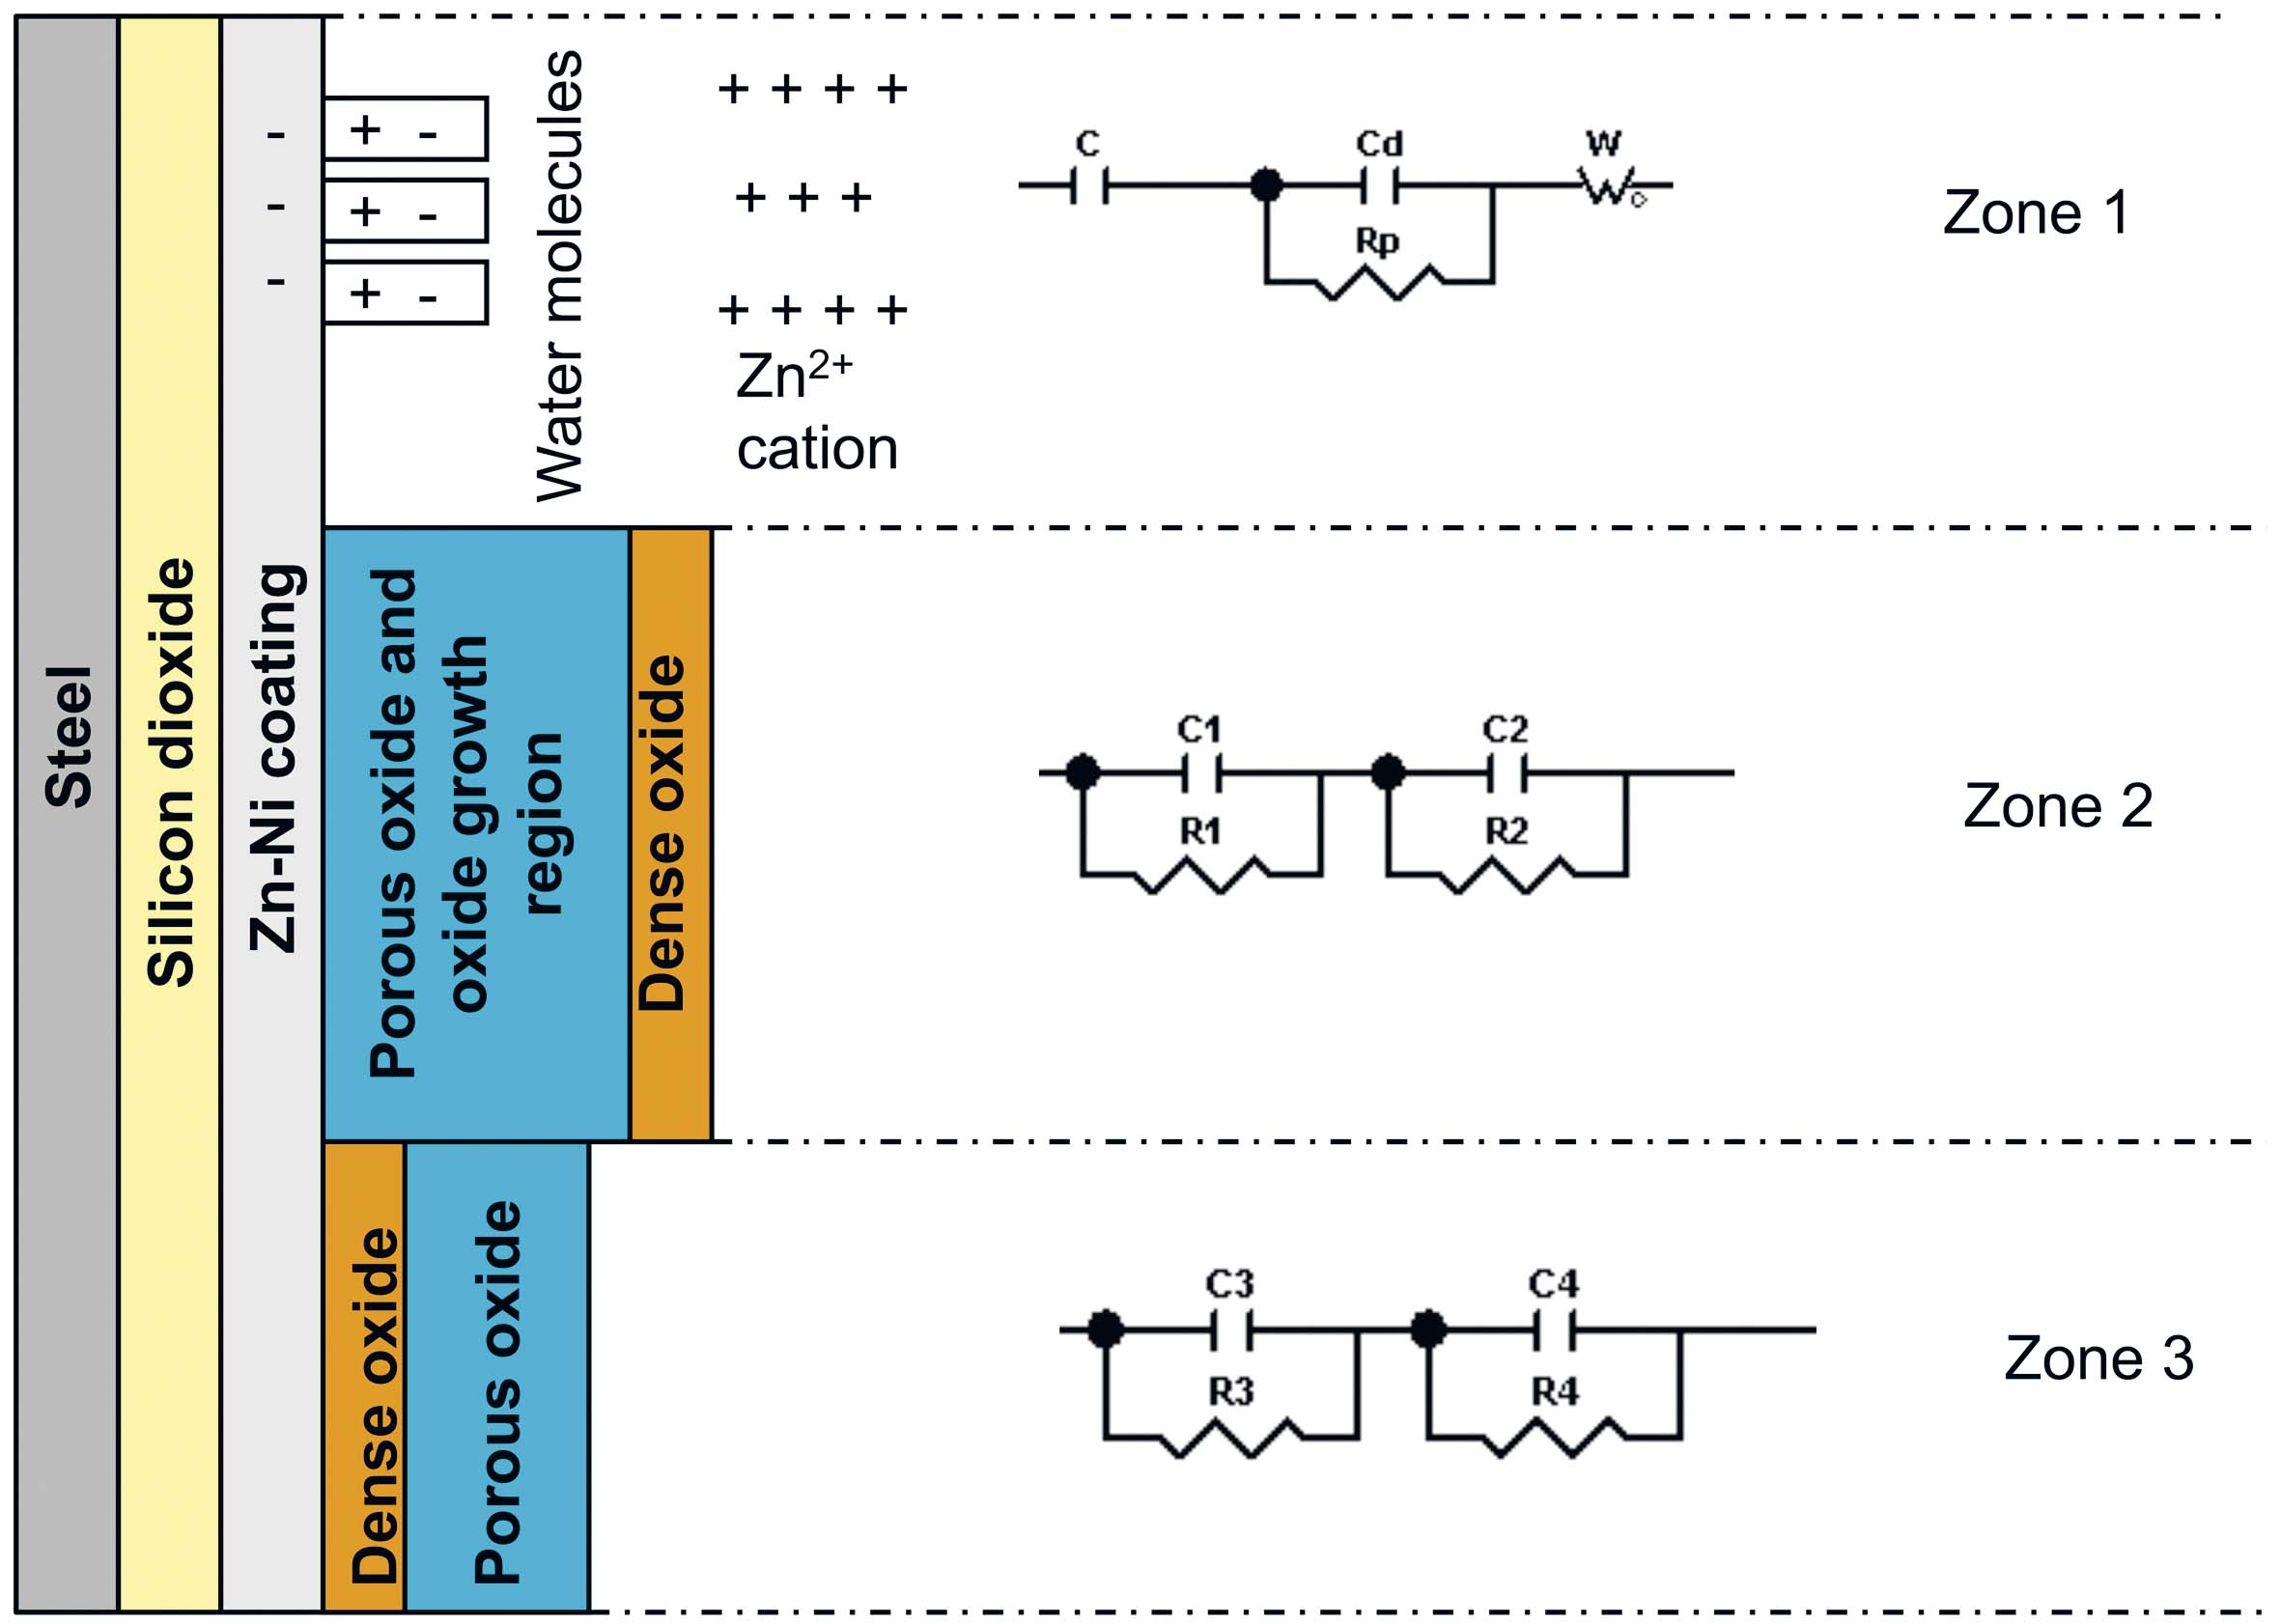
Fig. 17: Schematic representation of the three zones and equivalent circuit sides of
T_SiO2+Zn-Ni+bp+f sample
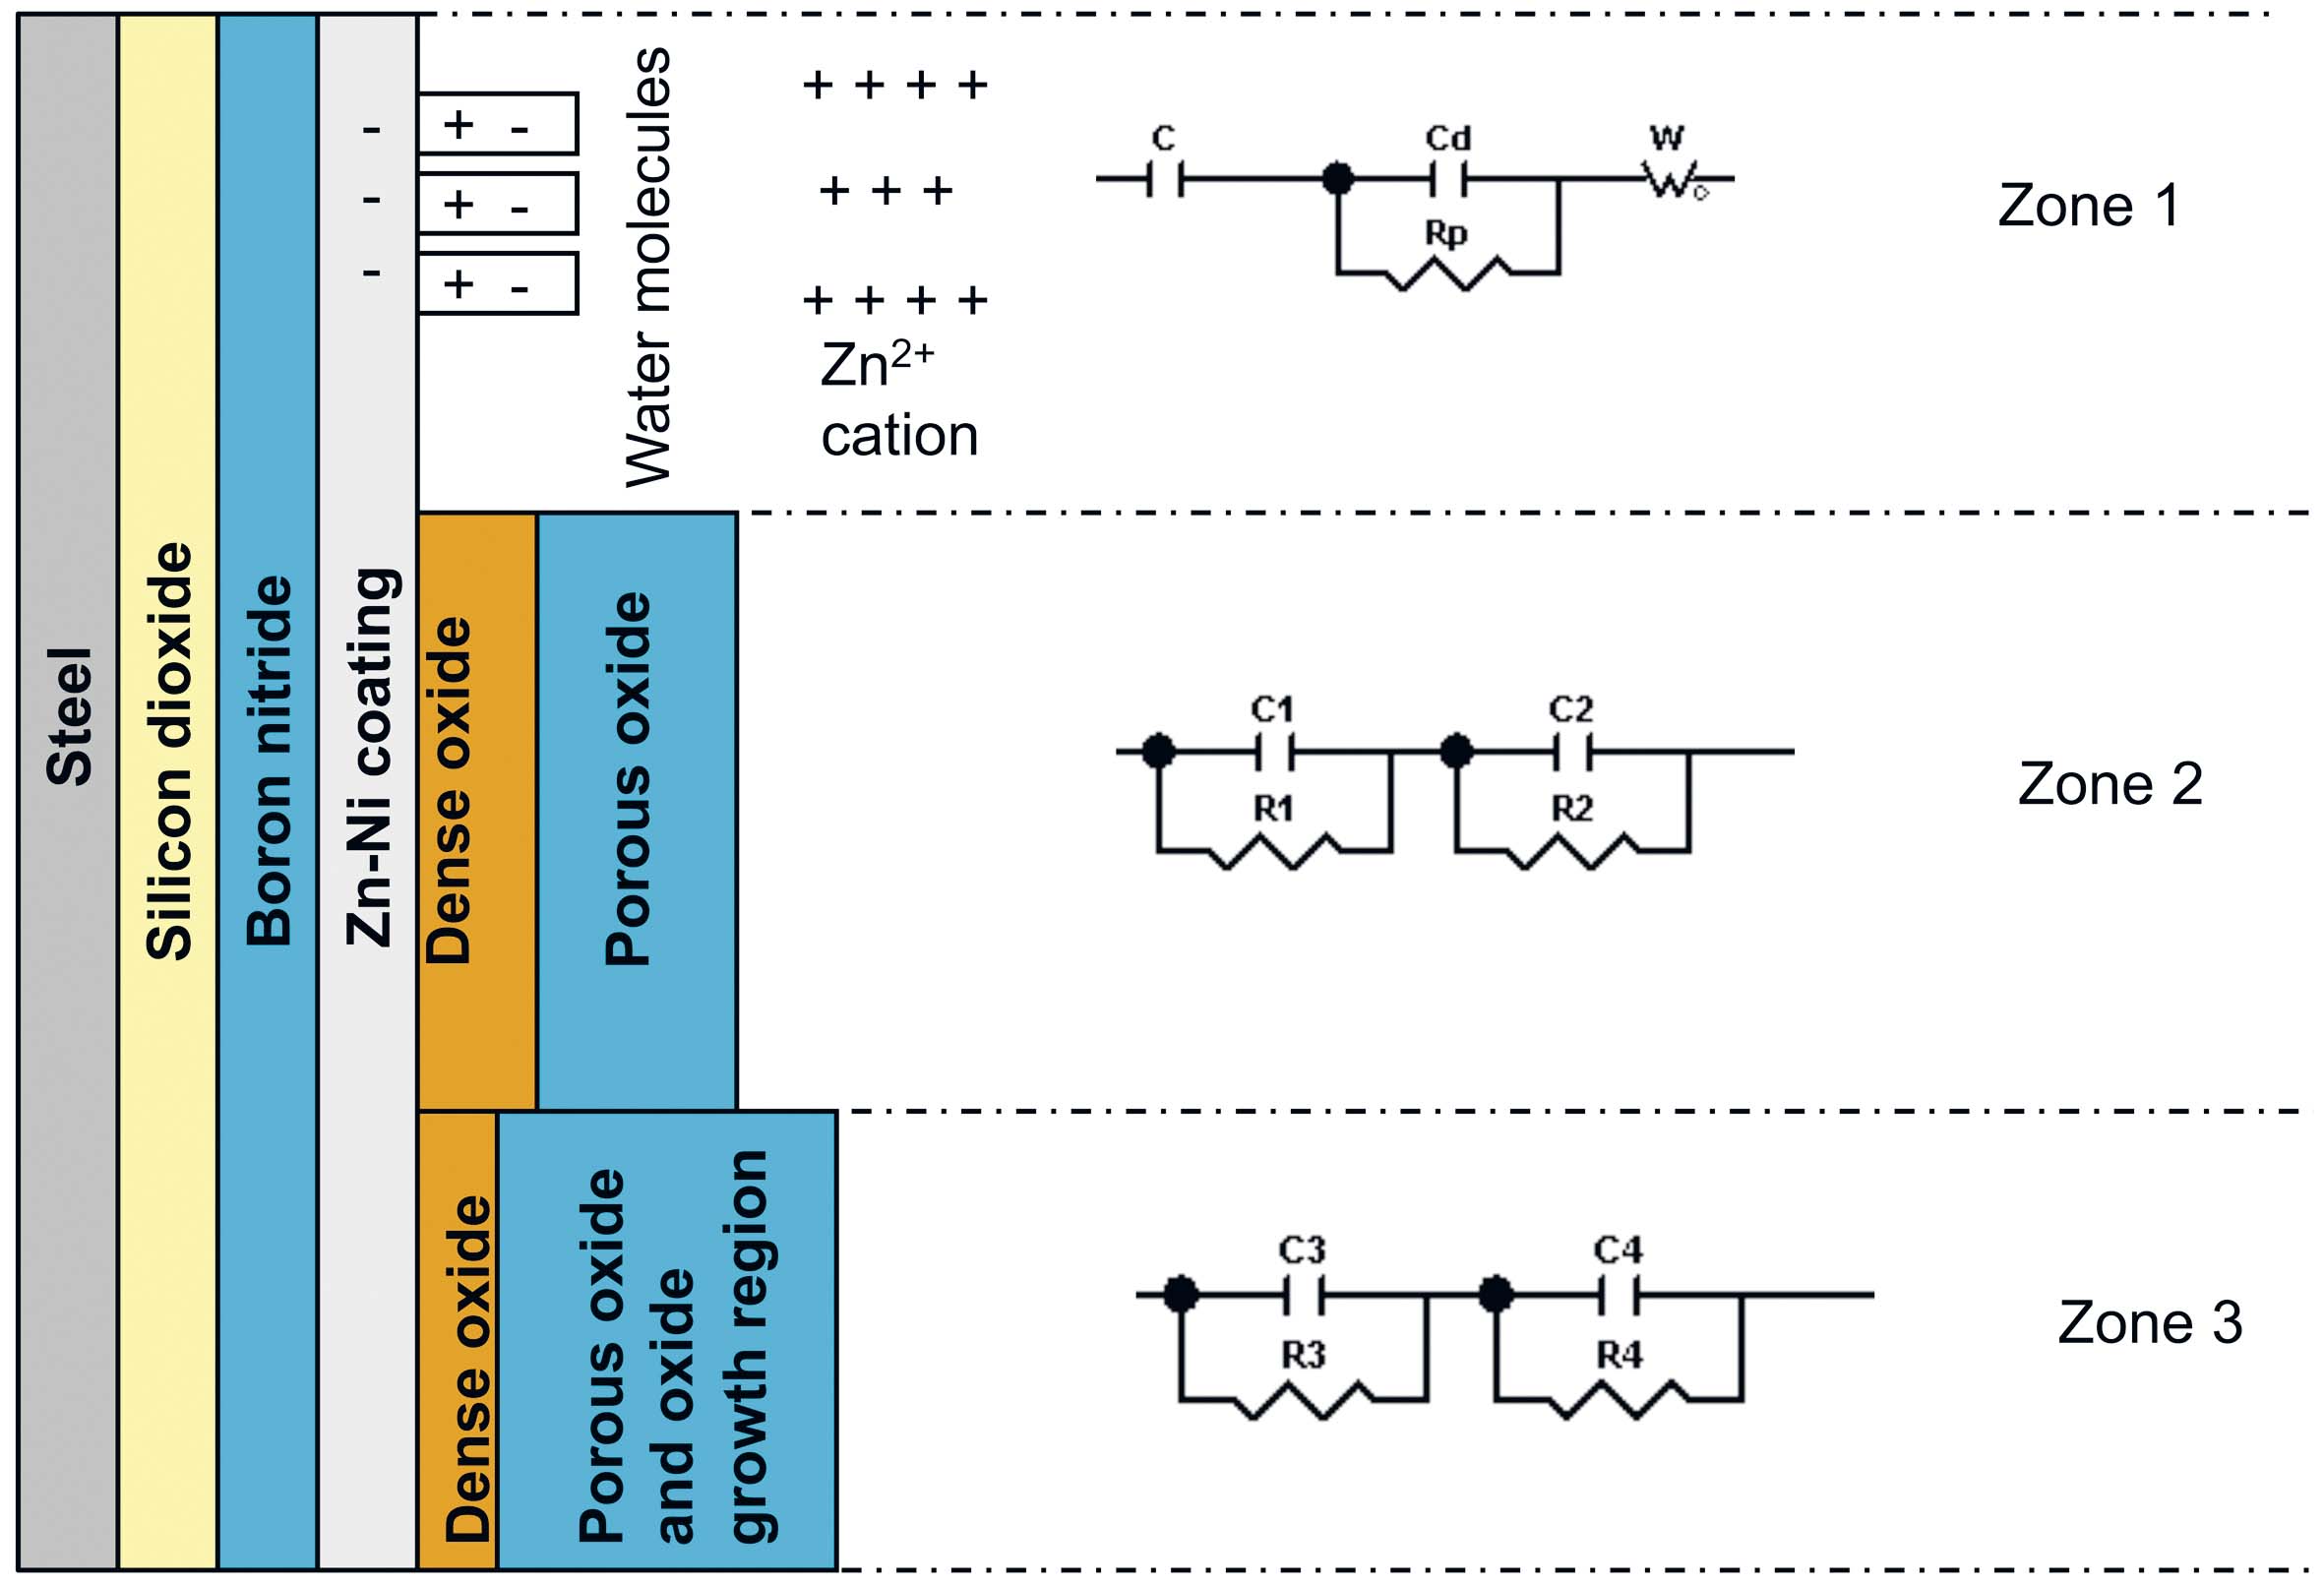
Fig. 18: Schematic representation of the three zones and circuit sides of the T_SiO2+BN+
Zn-Ni+f sample
The electrical double-layer thickness (dd), the oxide layer thicknesses (d1 + d2 and d3 + d4) and the diffusion length (L) were calculated based on the plan capacitor capacity (C = ε0εrS/d) and the Warburg capacity (W-T = L2/D) (Table 8).
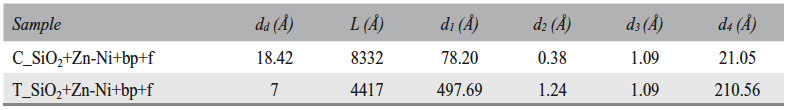
Tab. 8: Electrical double-layer thickness (dd), diffusion length (L), zone 2 oxide layer thickness (d1 and d2), and zone 3 oxide layer thickness (d3 and d4)
Based on Table 8 and Table 9 data, it was assumed that there are water molecules in the zone 1 of the T_SiO2+Zn-Ni+bp+f sample surface, between the metal surface and the Helmholtz plane, which determined a capacity C. Also, Zn2+ ion diffusion in solution occured in this zone; a phenomenon characterized by Warburg as impedance (W). The presence of Zn2+ ions in solution at a (dd) distance from the surface determines an electric doublelayer capacity (Cd) and a polarization resistance (Rp). In the zone 2, a (d1) porous oxide layer forms, followed by a (d2) compact oxide layer formation. The fact that the oxide is either porous or compact was deduced from the oxide layers thickness and the resistances values. The porous layer corresponds to a thicker oxide layer and a lower resistance. Lesser thickness and higher resistance result in a compact and dense oxide layer. The porous layer formed in the zone 2 is located at the metal/compact oxide interface, where it is an oxide layer growing zone. The compact oxide layer in the zone 3 is located on the metal surface at the metal/porous oxide interface (oxide growing zone).
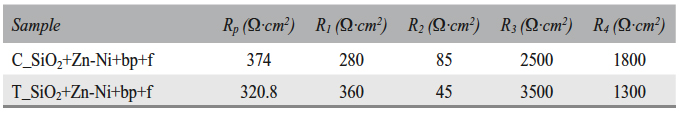
Tab. 9: Polarization resistance (Rp), zone 2 oxide layer resistances (R1 and R2), and zone 3 oxide layer resistances (R3 and R4)
Based on Table 10 and Table 11 data, it was assumed that in the case of T_SiO2+BN+Zn-Ni+f sample, the studied phenomena that took place in the zone 1, were the same as in the case of the T_SiO2+Zn-Ni+bp+f sample. The differences appear in the zones 2 and 3. In zone 2, a dense (d1) oxide layer forms, followed by a porous (d2) oxide layer formation. The oxide layer porousness or compactness quality was inferred based on the layer thick-
ness and on resistances values. In zone 3, even though the (d3) layer resistance decreased during the experiment, its resistance relative to its thickness was greater compared to the (d4) layer resistance. Therefore we can conclude that the (d3) layer is denser than the (d4) layer.
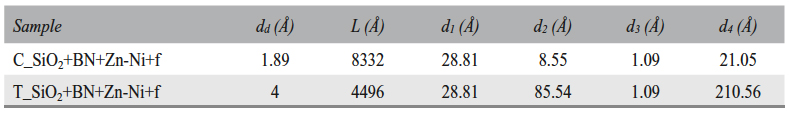
Tab. 10: Electric double-layer thickness (dd), diffusion length (L), zone 2 oxide layer thicknesses (d1 and d2), and zone 3 oxide layer thicknesses (d3 and d4)
Tab. 11: Polarization resistance (Rp), zone 2 oxide layers resistances (R1 and R2), and
zone 3 oxide layers resistances (R3 and R4)
It was found that a dense oxide layer formed on the SiO2+BN+Zn-Ni+f sample surface in the tribocorrosive environment – with exception of the active areas – followed by an oxide growing area. In the case of the SiO2+Zn-Ni+bp+f sample, dense oxide areas and oxide growing areas were observed on the sample surface. We can conclude that the SiO2+BN+Zn-Ni+f sample has the best tribocorrosion resistance.
3.6 Coefficient of friction and force of friction
In the case of the Ni-Zn sample (Fig. 19a and Fig. 19b), the force of friction and the coefficient of friction increased from Ff = 0.2 N/µ = 0,08 to Ff = 0.4 N/µ = 0.2, with slight variations due to the adhesion. According to the SEM images (Fig. 6a and Fig. 6b), plastic asperity deformation and micro-cracks are visible – caused by abrasion, and corrosion micro-zones are visible where the material was removed. In the case of the SiO2+Zn-Ni+bp+f sample (Fig. 19a and Fig. 19b), the force of friction and the coefficient of friction increased to Ff = 0.9 N/µ = 0.47, then slightly dropped around Ff = 0.7 N/µ = 0.39, with large variations due to adhesion and abrasion phenomena. According to SEM images (Fig. 7a and Fig. 7b), plastic asperity deformation and micro-cracks are visible – caused by abrasion, in areas where material has been removed. The force of friction and the coefficient of friction of the SiO2+BN+Zn-Ni+f sample (Fig. 19a and Fig. 19b) increased from Ff = 0.55 N/µ = 0.31 to Ff = 0.7 N/µ = 0.35, with strong variations due to adhesion. According to the SEM images (Fig. 8a and Fig. 8b), plastic asperity deformation, wear debris accumulation and corrosion areas without material removal are visible.
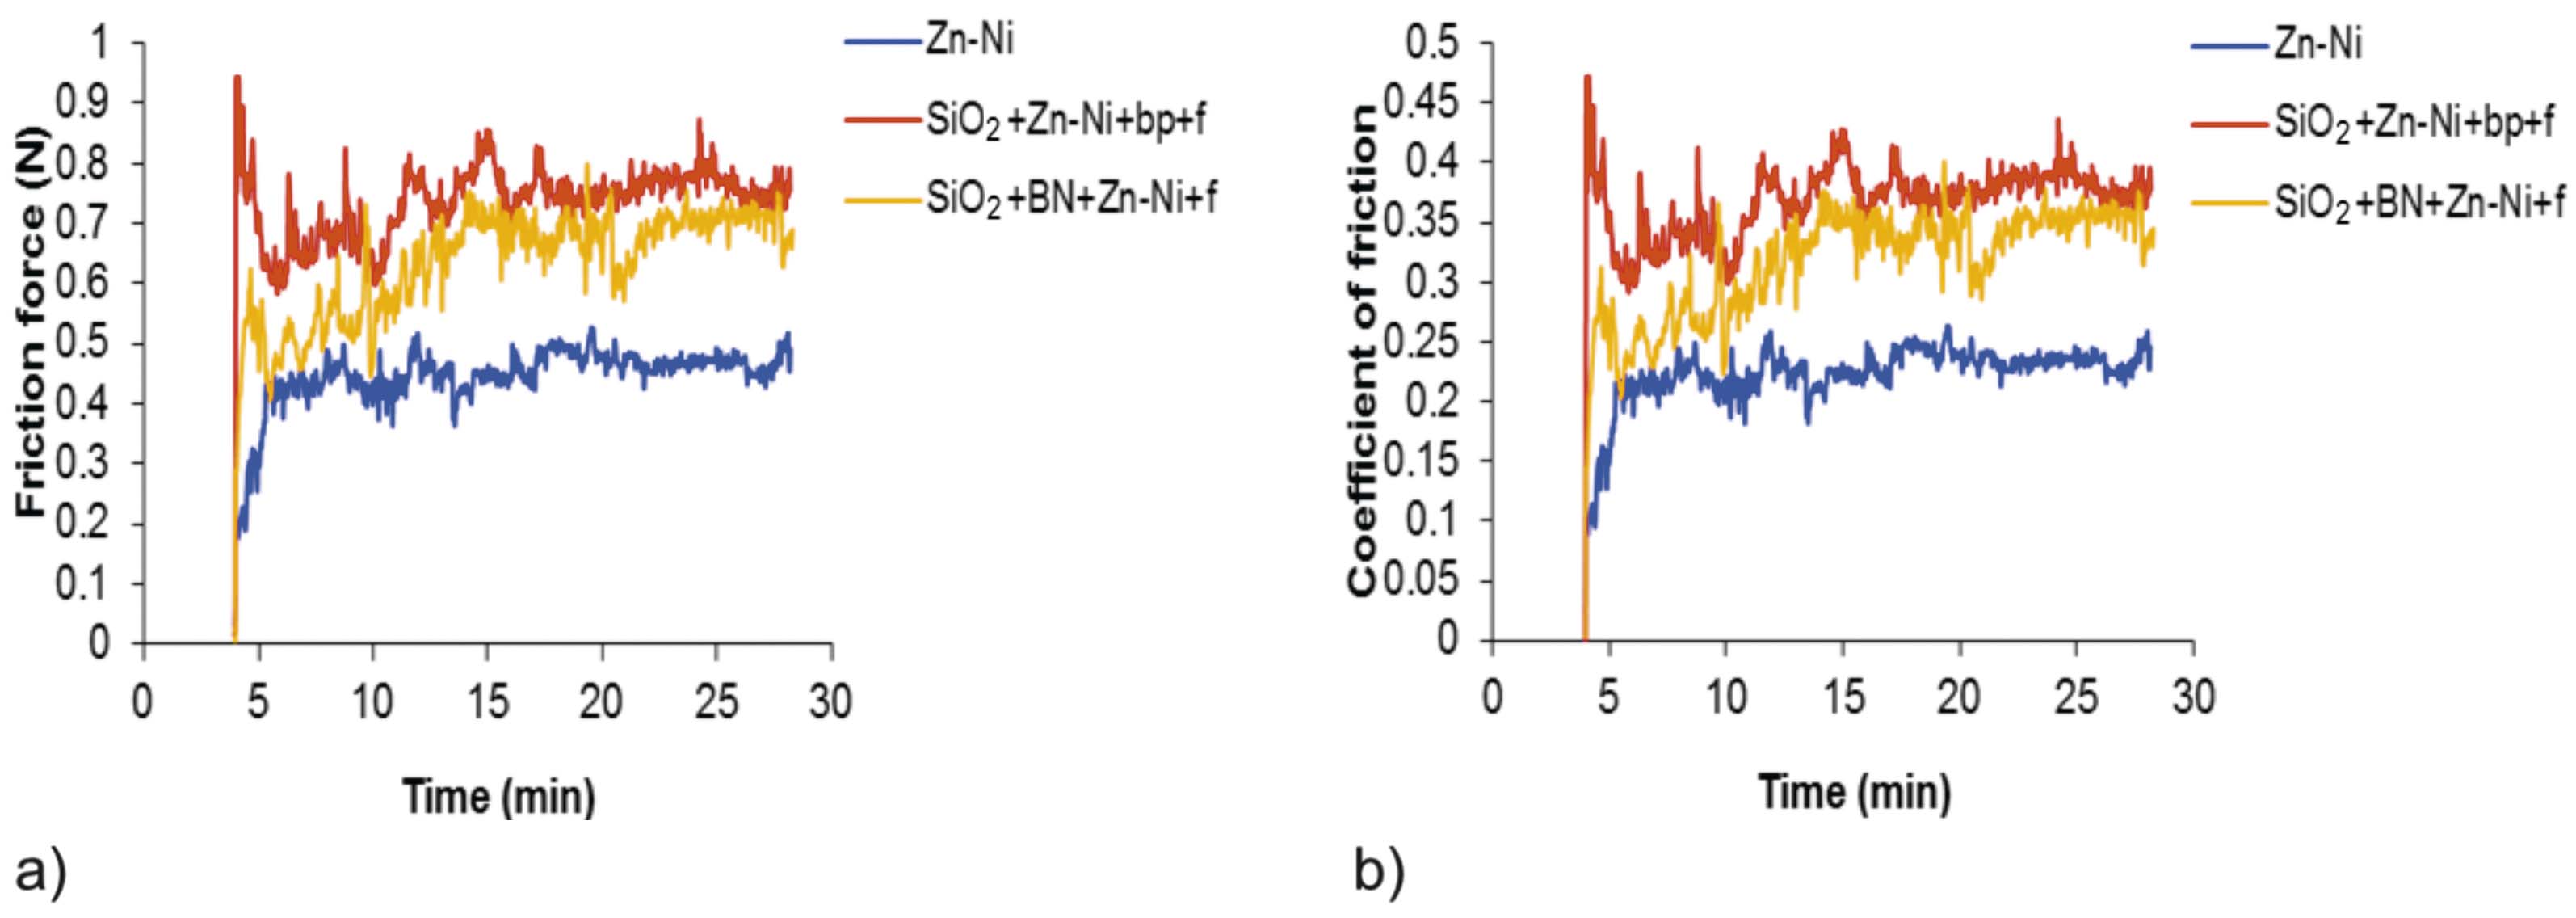
Fig. 19: a) Force of friction vs. time; and b) Coefficient of friction vs. time
It was found that all samples with silicon dioxide in their substrate composition reached the same force of friction and the same coefficient of friction values at the end of the measurement time (Fig. 19a and Fig. 19b). The conventionally electrodeposited sample (Ni-Zn) shows the lowest force of friction and lower coefficient of friction. The SiO2+BN+Zn-Ni+f sample shows the least chemical and mechanical damage.
4 Conclusions
- According to the OCP analysis for Zn-Ni, SiO2+Zn-Ni+bp+f and SiO2+BN+Zn-Ni+f samples, it was found that the SiO2+BN+Zn-Ni+f sample has the best tribocorrosion resistance. Even though the Zn-Ni sample’s measured potential had shown a positive shift tendency, its value was more negative compared to the SiO2+Zn-Ni+bp+f sample, which had a negative shift tendency and finally remained stable. We can conclude that the SiO2+BN+Zn-Ni+f and SiO2+Zn-Ni+bp+f samples are more resistant to the combined action of mechanical and chemical factors, compared to the Zn-Ni sample.
- According to the chrono-amperometry measurements, the samples having silicon dioxide in their composition show lower current densities, corresponding to a lesser coating layer dissolution and thus to a better protection provided by the oxide layer formation.
- According to the EIS measurements, the SiO2+BN+Zn-Ni+f sample polarization resistance is higher compared to the samples with boron nitride in the substrate composition. Also, according to the interpretation of the Nyquist equivalent circuit diagrams, there are many zones covered by higher density oxide, which protect the surface.
- According to the SEM images analysis and to AFM and XRD measurements, it was found that the SiO2+BN+Zn-Ni+f sample had the least tribocorrosion damage. Also, the samples containing silicon dioxide had a higher roughness. The electrodeposited alloy on the sample’s surface was phase γ Ni2Zn11 and the oxide formed on the surface was nickel oxide.
- It was found that all samples with silicon dioxide in the substrate reached the same force of friction and the same coefficient of friction values at the end of the testing time. The conventionally electrodeposited Zn-Ni sample had lower force of friction and lower coefficient of friction values compared to the other samples. The SiO2+BN+Zn-Ni+f sample had the least chemical and mechanical damage.
Bibliography
- Fontana, M.G.: Corrosion engineering, McGraw-Hill Book, New York, 1986, p. 105
- Waterhouse R.B.: Fretting corrosion, Oxford Pergamon Press, Oxford, 1972, p. 184
- Chowdhurya, M.Pal; Chakrabortyb, B.R.; Pala, A.K.: Novel electrodeposition route for the synthesis of mixed boron nitride films, Materials Letters 58(2004), 3362–3367
- Wilcox, G.D.; Gabe, D.R.: Electrodeposited zinc alloy coatings, Corros. Sci. 35(1993), p. 1251
- Ponthiaux, P.; Wenger, F.; Drees, D.; Celis, J.P.: Electrochemical techniques for studying tribocorrosion processes, Wear 256(2004), p. 459
- Azzi, M.; Benkahoul, M.; Szpunar, J.A.; Klemberg-Sapieha, J.E.; Martinu, L.: Tribological properties of CrSiN-coated 301 stainless steel under wet and dry conditions, Wear 267(2009), 882
- Azzi, M.; Paquette, M.; Szpunar, J.A.; Klemberg-Sapieha, J.E.; Martinu, L.: Tribocorrosion behaviour of DLC-coated 316L stainless steel Wear 267(2009), 860
- Guruvenket, S.; Azzi, M.; Li, D.; Szpunar, J.A.; Martinu, L.; Klemberg-Sapieha, J.E.: Structural, mechanical, tribological, and corrosion properties of a-SiC:H coatings prepared by PECVD Surf.Coat. Technol. 204(2010), p. 3358
- Hassani, S.; Raeissi, K.; Azzi, M.; Li, D.; Golozar, M.A.; Szpunar, J.A.: Improving the corrosion and tribocorrosion resistance of Ni-Co nanocrystalline coatings in NaOH solution Corros. Sci. 51(2009), p.2371
- Li, D.; Guruvenket, S.; Azzi, M.; Szpunar, J.A.; Klemberg-Sapieha, J.E.; Martinu, L.: Corrosion and tribo-corrosion behavior of a-SiCx:H, a-SiNx:H and a-SiCxNy:H coatings on SS301 substrate Surf.Coat. Technol. 204(2010), p. 1616
- Alfantazi, A.M.; Erb, U.: Corrosion Properties of Pulse-Plated Zinc-Nickel Alloy Coatings Corrosion 52(1996), 880
- Fabri Miranda, F.J.: Corrosion Behavior of Zinc-Nickel Alloy Electrodeposited Coatings Corrosion 55(1999), 732
- Fedrizzi, L.; Ciaghi, L.; Bonora, P.L.; Fratesi, R.; Roventi, G.: Corrosion behaviour of electrogalvanized steel in sodium chloride and ammonium sulphate solutions; a study by E.I.SJ. Appl. Electrochem. 22(1992), 247
- Park, H.; Szpunar, J.A.: The role of texture and morphology in optimizing the corrosion resistance of zinc-based electrogalvanized coatings Corros. Sci. 40(1998), p. 525
- Rahsepar, M.; Bahrololoom, M.E.: Corrosion study of Ni/Zn compositionally modulated multilayer coatings using electrochemical impedance spectroscopy Corros. Sci. 51(2009), p. 2537
- Panagopoulos, C.N.; Georgarakis, K.G.; Agathocleous, P.E.: Sliding wear behaviour of Zinc-Nickel alloy
PDF Version of the article |
||
| [qrcode] | ||