
1. Introduction
Electrolytic capacitors are characterized by the phase sequence electronic conductor / dielectric medium / electrolyte where the electronic conductor is a metal (typically Al or Ta) or an oxide (NbO) and the dielectric medium is an insulating oxide film (Al2O3, Ta2O5, SiO2, and Nb2O5). The electrolyte is a viscous or solid. Electrolytes are usually defined as ionic conductors, but for electrolytic capacitors the electronic conductivity is predominant.
The capacitance of the device C’ can be calculated from the common equation of the parallel plate condenser
Equation 1:
C’ = A · e · e0/d
where A is the surface area, e the relative dielectric number, e0 the dielectric number of vacuum and d the distance of the plates. In electrochemistry, data are usually normalized to the area and, thus, the capacity density C is given by
Equation 2:
C = e · e0/d
In electrolytic capacitors, the plates are formed by the metal and the electrolyte. The oxide film represents the dielectric medium. Equation 1 is also valid for structured surfaces, provided that the thickness of the dielectric remains constant, but just this is guaranteed by anodic oxidation.
According to equation 1, three concepts can be followed to get small, powerful devices:
- Large plate areas A. This is realized by use of roughened, rolled Al foils or by sintered sponges made from Ta powders.
- Thin dielectrics. Common are thicknesses of some 10 nm which means, the oxide must withstand extreme electric field strengths up to some MV/cm without dielectric breakdown. Accordingly, these thin films are the most sensitive part of the capacitor.
- Use of oxides with large dielectric numbers, e. g. SiO2 ≈ 4, Al2O3 ≈ 9, Ta2O5 ≈ 28, NB2O5 ≈ 42.
Tantalum oxide is often used as a dielectric due to its unique properties. It is highly corrosion resistant, has a relative large dielectric number and is easily produced with constant thickness by anodization in aqueous electrolytes, forming thin, homogeneous and non-porous films.
Typical Ta electrolytic capacitors consist of a pellet of sintered Ta particles, covered with an anodic oxide film. The pores are filled with a solid state electrolyte such as MnO2 or conducting polymers such as poly-thiophenes, poly-pyrroles, etc.
2. Anodization of Tantalum
The sintered Ta bodies are anodized e. g. in aqueous phosphoric acid. The anodic oxide formation follows:
Equation 3:
2 Ta + 5 H2O → Ta2O5 + 10 H+ + 10 e–
The oxide film properties are similar to ceramics. They are perfect insulators for electron transport, due to the large band gap of about 4 to 5 eV.
Ionic movement is necessary for oxide growth and becomes possible at extreme field strengths of 5 to 10 MV/cm. The moving ions follow a special field supported hopping mechanism with activation energies around 1.5 eV, which is explained by the high-field model [1].
During growth, cations (Ta5+) from Ta metal enter the oxide, migrate through the oxide to the electrolyte interface and form there, together with oxygen ions from water, new oxide. In parallel, anions (O2–) from water migrate to the metal interface and form there with Ta new oxide, i. e. the oxide growths at both interfaces. Reason for this mechanism is the high field strength of 5 to 10 MV/cm which is necessary for ion migration.
The current density i depends on the electric field strength E inside the oxide film
Equation 4
where i0 and β are oxide specific constants. The field strength E can be substituted by the potential drop DU across the oxide film over its thickness d. DU is calculated from the electrochemical potential U by
Equation 5:
DU = U – U0
where U0 is a zero field potential, which is often close to the equilibrium potential of the oxide electrode, for Ta U0 ≈ –0.6 V.
The time and potential dependent oxide growth is obtained from equation 4 and Faraday’s law by
Equation 6
with the molecular mass of the oxide M (441.9 g/mol), the Faraday number F (96 485 C/mol) and the density χ (8.5 g/cm3); y is the number of electrons required to form one molecule of oxide (eq. 3). U0, i0 and β are taken from experiments. The differential equation (eq. 6) has no algebraic solution and must be solved by numeric integration.
3. Characterization of sintered Ta bodies
A reliable production of Ta capacitors requires precise characterization of the sintered sponge-like Ta pellets. This includes determination of active areas, oxide thicknesses, capacitances and influence of particle sizes and electrolytes. Due to the special geometry significant differences compared to experiments at sheets or wires must be expected:
- The particle radius comes nowadays down to the range of oxide film thickness. Thus, the common planar growth on sheets or wires changes into a spherical one.
- The small electrolyte volume of the pores means higher resistances, local pH shifts due to hindered diffusion and corresponding shift of equilibrium potentials during anodization.
- The diameter of sinter contacts is smaller than the particle size and can completely transform into oxide. Therefore, parts of the sinter body will loose electric contact during anodization.
- Side reactions such as corrosion, i.e. chemical dissolution of the oxide at the interface oxide/electrolyte, or oxygen evolution must be respected.
- Finally, the effects of pre-treatment must be investigated.
The anodic formation of the oxide film is an electrochemical process and, therefore, it is obvious to use electrochemical techniques for characterization such as cyclic voltammetry, current transients or impedance spectroscopy, which are presented in this section.
Special effects caused by the special geometry of the sintered sponge-like Ta bodies are discussed in section 4.
3.1. Electrodes and set-up
Sintered porous Ta anodes for capacitor applications or electropolished Ta wires (99.9 %) with diameters around 0.3 mm and a length around 10 mm were used as electrodes (H.C. Starck GmbH, Goslar, Germany). The sintered Ta anodes had volumes of around 1 m3 and electrochemically active surfaces from 30 to 300 cm2. Wires were preferred in some experiments as the complex sinter structure will add further complications.
The electrolytes were 1.84 M sulphuric acid (pH 0) or 0.05 M phosphoric acid (pH 1.5) in most cases. Potential control was maintained by a computer controlled potentiostat system [1]. A Solartron 1255 was used for impedance measurements from 100 kHz to 100 mHz.
3.2. Experimental cyclovoltammograms and oxide thickness
Cyclovoltammograms are perfect tools to characterize the anodic processes at valve metals such as Al, Hf, Nb, Ti, Ta or Zr.
A cyclovoltammogram of a Ta wire is shown in figure 1. The experiment started at 0 V where only the native oxide film of about 1 nm is present. The potential was increased with a constant sweep rate ∂U/∂t = 100 mV/s. The field strength in the native oxide became sufficiently high to form new oxide at 0.25 V and the current increased.
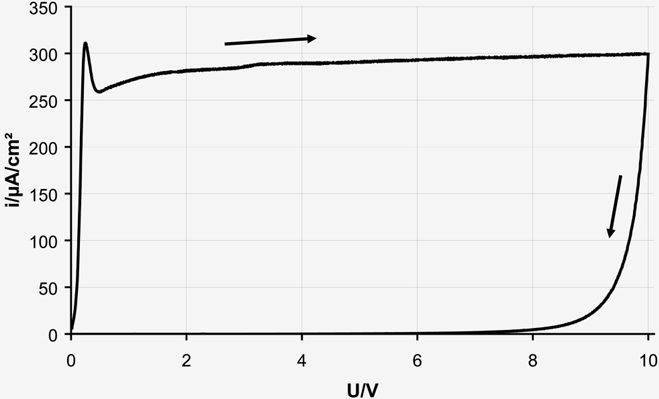
Fig. 1: Cyclovoltammogram on Ta-wire in 1.84 M sulphuric acid with 100 mV/s
From now, the oxide grew and, as the potential was increased in parallel, the field strength remained constant and, according to equation 4, the current as well (so-called plateau current). The sweep direction was reversed at 10 V, the field strength became smaller and the growth was strongly reduced. The oxide just formed remained on the surface, and the current of further sweeps with higher reverse potentials (see fig. 6a) increased not until the former reverse potential was reached.
The initial thickness of the oxide film, formed by thermal treatment and air oxidation or previous anodization, can be calculated from the first onset of current density. The half step potential in the anodic sweep of cyclovoltammograms is a measure of the initial oxide thickness d, according to
Equation 7:
d = k(U – U0)
with oxide specific data: an oxide potential U0 ≈ –0.6 V and a formation factor k ≈ 1.65 nm/V at ∂U/∂t = 100 mV/s. This is true for a sudden onset of current as in figure 1. If the oxide film is structured in thickness, the anodic onset is modified and gives information concerning thickness distribution. This will be demonstrated in a special experiment (figs. 3 and 4).
The thickness of the native oxide on Ta anodes before anodization depends on the pre-treatment. It is in the range of 1 nm for freshly electropolished or etched electrodes, grows up to 2 nm at room temperature and can reach values as high as 11 nm if Ta anodes are heat treated in air at e. g. 300 °C.
3.3. Experimental cyclovoltammograms and surface area
More important data can be taken from such cyclovoltammograms. The plateau current is proportional to the electrode surface and can be calibrated using extremely smooth (electropolished) electrodes. The result for Ta is 300 µA/cm2 at a sweep rate of 100 mV/s. By this, the area A of Ta surfaces of complex shape can be easily determined:
Equation 8:
A = Iplateau/300 µAcm–2
This procedure can be used to determine the active area of sintered Ta bodies. An alternative technique is BET adsorption, which means primarily a determination of gas molecule adsorption sites. This indicates that a ‘true’ surface area in atomistic dimensions cannot exist as every technique interprets different surface properties or modifies the surface structure. Anodization, which is prerequisite of capacitor production, means a quasi-polishing effect which reduces the surface area (fig. 2). Moreover, BET adsorption respects parts not affected by anodization, e.g. pores not wetted by the electrolyte or particles without electric contact.

Fig. 2: Scheme of quasi-polishing by anodization
Table 1 shows some examples of sintered Ta anodes made from two different Ta powders with particle sizes between 100 nm (STA150KA) and 1 000 nm (STA18KT). The native oxide film was about 4 nm and grew at 300 °C with air contact up to values around 7 nm with a wide distribution of thicknesses. Significant are the different results of area measurements by both techniques. The electrochemically addressable area is much smaller than that from adsorption as already expected.
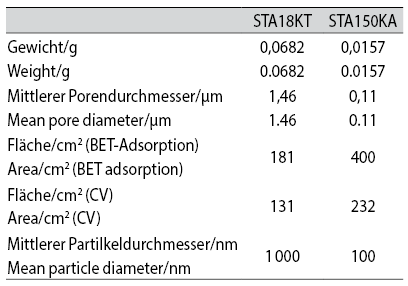
Tab. 1: Mean parameter of sintered Ta bodies STA18KT and STA150KA.
A Ta wire was prepared with 4 sections of different thickness. This was done by a step-by-step anodization procedure:
- dipping about 25 %, anodizing to 8 V,
- dipping about 50 %, anodizing to 6 V,
- dipping about 75 %, anodizing to 4 V,
- dipping about 100 %, anodizing to 2 V,
The resulting thickness distribution is shown in figure 3. The final cyclovoltammogram up to 10 V is presented in figure 4. The thinnest parts grow first, then the second thinnest and so on. From 8.5 V, all parts grow with the same plateau current and form a homogeneous oxide of constant thickness.
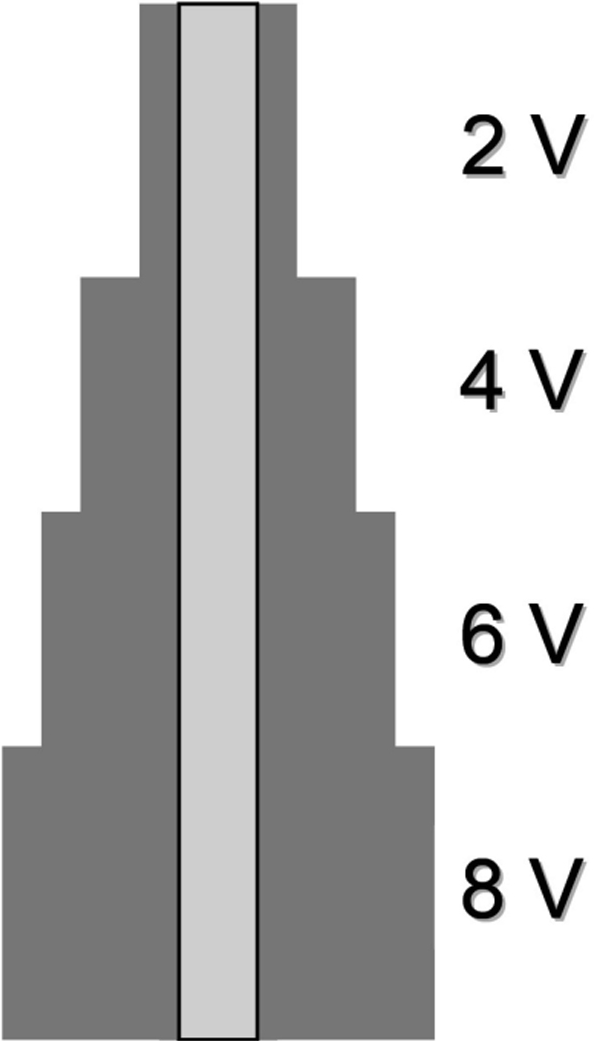
Fig. 3: Scheme of thicknesses for a step-by-step anodization
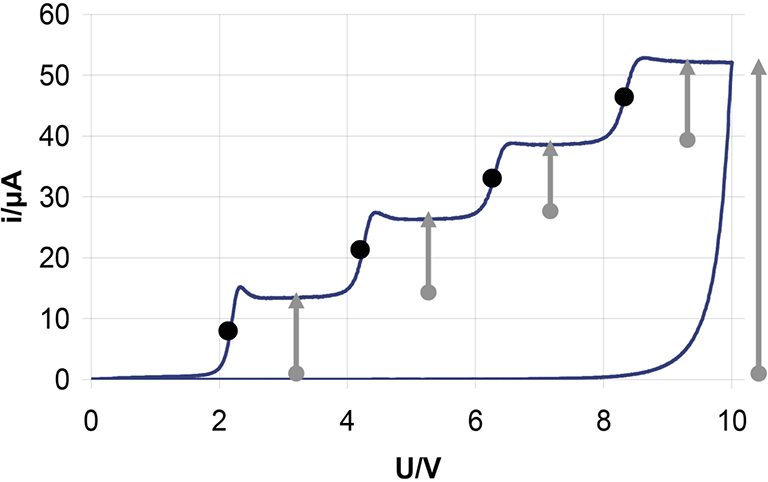
Fig. 4: Cyclovoltammograms of a Ta wire, prepared with 4 sections of different thickness and then anodized from 0 V to 10 V, 1.84 M sulphuric acid, 100 mV/s
The initial thicknesses and the areas of the different sections can be taken from the cyclovoltammogram (fig. 4). The dots mark the potentials U½ of half-step currents, the small arrows the individual plateau currents iP of the different sections and the large arrow the final plateau current, affecting the complete area. Table 2 shows all data taken from figure 4, the plateau currents iP, the step heights Di, the corresponding areas A in cm2, % of the total surface, the half step potentials and the corresponding thicknesses.
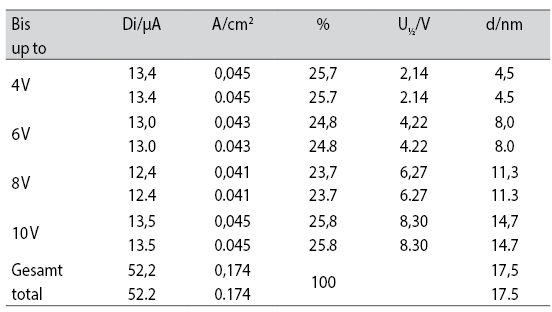
Tab. 2:
This experiment demonstrates in addition, that the electrode does not memorize previous anodization processes, provided that the final potential was larger than all previous ones. This means, all effects of pre-treatment on thickness or dielectric properties vanish, if the final anodization potential is chosen so high that all parts of the surface took part at the further anodic growth. This is schematized in figure 5.
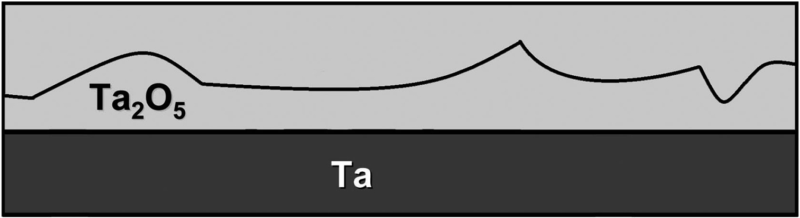
Fig. 5: Scheme of further anodization. The previously structured oxide becomes homogeneous in thickness.
3.4. Simulated cyclovoltammograms
The validity of the high-field model can be easily confirmed by simulations. Random experiments can be simulated by numeric integration of equation 6. Figure 6 compares an experiment to calculations: a sequence of cyclovoltammograms with increasing reverse potential (2 V, 4 V, 6 V, 8 V, 10 V) is compared to the corresponding simulation. Calculated and experimental transients fit well; small deviations of the increasing current part are due to a delayed formation of mobile ions at the interfaces. This process was also modelled in more detail by a finite element simulation [1] but will not be discussed here.
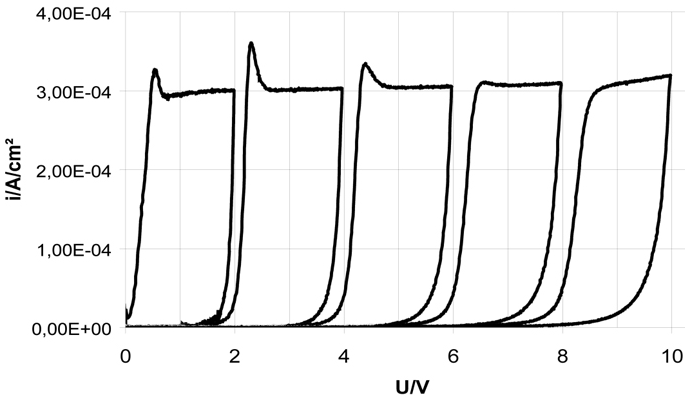
Fig. 6a: Sequence of experimental cyclovoltammograms in 1.84 M sulphuric acid with increasing reverse potentials 2 V, 4 V, 6 V, 8 V, 10 V), ∂U/∂t = 100 mV/s
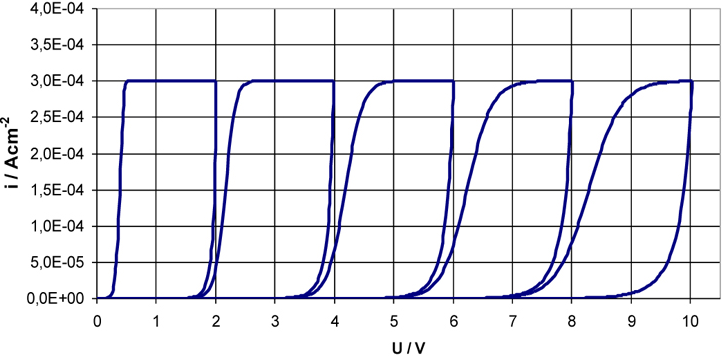
Fig. 6b: Simulated cyclovoltammograms with increasing reverse potential (2 V, 4 V, 6 V, 8 V, 10 V), ∂U/∂t = 100 mV/s, β = 56 nm/V, i0 = 7 · 10–18 A/cm2
4. Effects of sample geometry and side reactions
4.1. Spherical oxide growth
The high-field model in section 2 handles the oxide film as a planar system. This is true as long as the oxide thickness is much smaller than the particle diameter in the sintered body. If not, the anodic oxide growth transforms into spherical shell geometry (figure 7). The local field strength and the local ionic current density are no longer constant and position independent. They decrease from the inner oxide interface to the outer one.
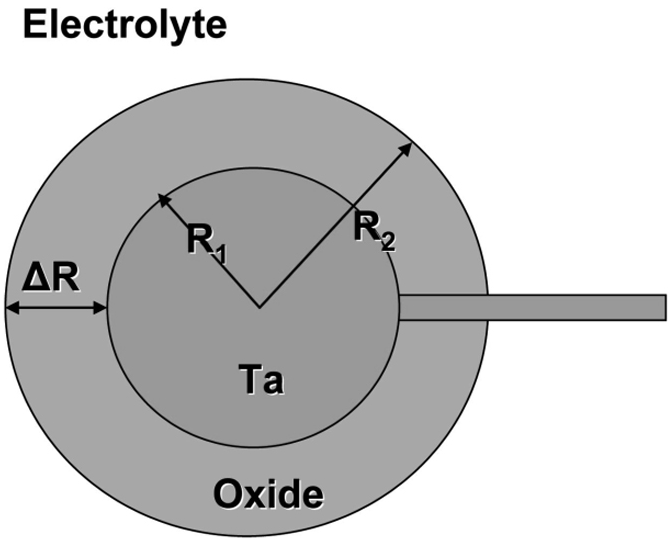
Fig. 7: Scheme for modelling of spherical oxide growth with metal radius R1 and outer oxide radius R2
Therefore, we modified the model, based on the idea that the absolute current I must be constant in all oxide spheres. This means, equation 4 must be substituted by a more complex version
Equation 9
Figure 8a shows a simulated cyclovoltammogram at a Ta sphere with a radius of 10 nm and 2 nm oxide. The sweep rate is 100 mV/s. The initially present oxide inhibits growth up to 0.4 V. The field strength becomes sufficiently high for further oxide growth at this potential.
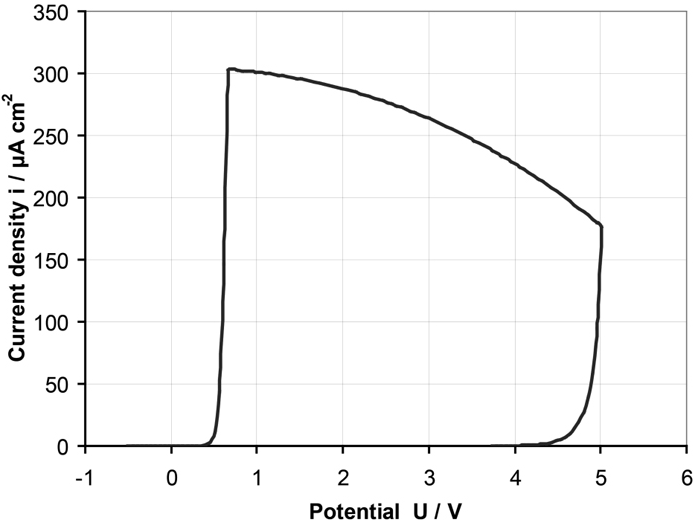
Fig. 8a: Simulated cyclovoltammogram. Initial Ta ball diameter 20 nm, initial oxide thickness 2 nm, sweep rate 100 mV/s
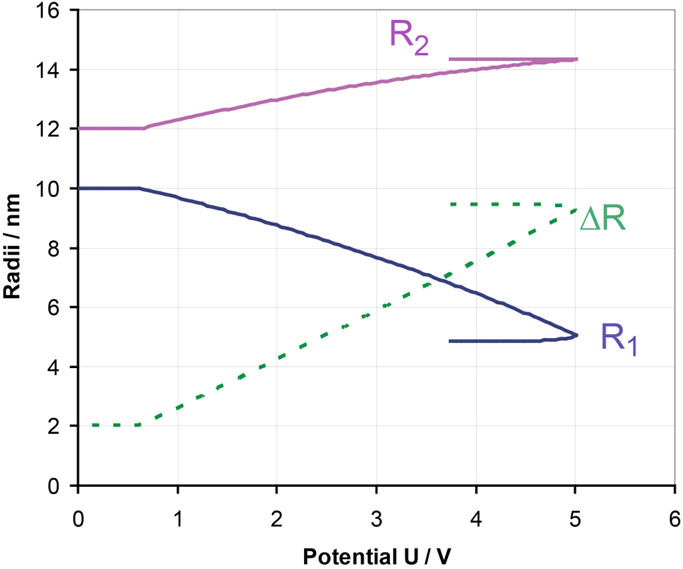
Fig. 8b: Corresponding potential dependent radii of Ta ball R1, outer oxide sphere R2 and oxide thickness ΔR
Macro electrodes are characterized by a constant anodic plateau current of oxide formation of about 300 µA/cm2 at 100 mV/s, due to a constant field strength within the oxide; the tiny sphere, however, shows a slowly decreasing current, due to the shrinking metal surface. In the back sweep, the field strength becomes smaller and the oxide current decreases rapidly to almost zero.
Figure 8b shows the corresponding potential dependent radii R1, R2 and ΔR. The oxide film thickness ΔR increases up to almost 10 nm. At 1 V, for example, the oxide film thickness is 2.66 nm and spreads from 9.8 nm to 12.30 nm. The electric field in the oxide decreases with increasing radius. It is slightly larger close to the metal surface (E = 6.19 MV/cm) and decreases to the electrolyte interface (E = 6.11 MV/cm). In a macro electrode, the value of field strength is in between and constant all over the oxide (E = 6.15 MV/cm).
4.2. Corrosion
The second possible side reaction is oxide corrosion,
Equation 10:
Ta2O5 + 10 H+ → 2 Ta5+ + 5 H2O
a process which means no charge transport in the outer circuit. Corrosion is easily separated in transient experiments.
A sintered Ta anode was anodized with a sweep rate of 10 mV/s up to 10 V (which requires 1 000 s) and than potentiostatted at this potential. The current density was recorded all the time and presented in a double logarithmic plot (fig. 9). Experiment and simulation according to equations 6 and 9 fit well. Additionally, a simulation with a fictive corrosion current of 1 µA/cm2 was added. The anodic current becomes constant in this case, as corrosion and reformation become equal and we get stationary conditions. These deviations are not observed in the experiment and, therefore, the corrosion current must be smaller than 10 nA/cm2 .
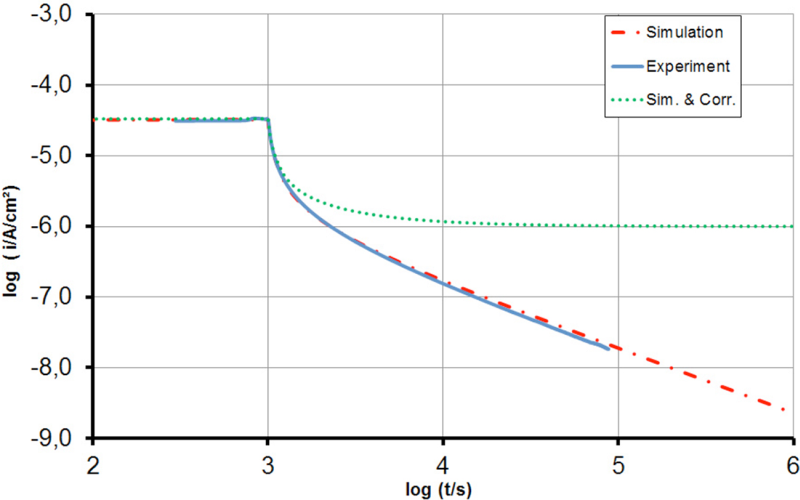
Fig. 9: Current transient in double logarithmic plot. A sintered Ta anode was anodized with a sweep rate of 10 mV/s up to 10 V and then potentiostatted at this potential. Experiment and simulation (numeric integration of equations. 6 and 9) fit perfectly, corrosion is not detected. For illustration, a fictive corrosion current of 1 µA/cm2 was added to a second run of simulation
4.3. Oxygen evolution
Oxygen evolution proceeds at the interface oxide/electrolyte according to
Equation 11:
2 H2O → O2 + 4 H+ + 4 e–
which means electrons must cross the oxide film to reach the metal electrode.
Oxide growth means a transport of ions (cations and/or oxygen ions) through the oxide film, as described in section 2. This ionic conductivity, which is notable only at high field strength, must be separated from electronic conductivity. Ionic conductivity is based on a field supported hopping of ions, electron transport is either explained by the semiconductor band model or as a quantum mechanical tunnel process.
Oxygen evolution on metals such as Ta or Al was excluded in the former literature [1, 2, 3]. Current efficiencies of oxide formation > 99 % were reported. This seemed to be true as no bubble formation was observed on Ta sheets or wires. On the other hand, strong gas evolution is observed during anodization of tantalum anodes for electrolytic capacitor fabrication.
Bubble formation, however, requires anodic current densities which >> 100 µA/cm2, otherwise the oxygen is dissolved in the electrolyte, removed by diffusion and not noticed.
A detailed investigation [4] showed that oxygen is only produced during significant oxide growth, which indicates a contribution of the moving ions, eventually forming terms in the band gap. The oxide growth is not affected and only 4 % of the total anodic charge are consumed for oxygen evolution.
4.4. The influence of pores
The properties of porous systems will differ from planar electrodes in many aspects. The tiny pores mean large electrolyte resistances and, accordingly, addressing the inner parts of the sintered body via these pores mean significant potential drops during current flow. This means potential gradients during anodization and a complex network of local interface capacities and pore resistances for impedance measurements.
These problems can be overcome by use of highly conductive electrolytes. Figure 10 shows cyclovoltammograms with different electrolytes. 0.05 M phosphoric acid is a common electrolyte in industry. The anodic sweep shows a delayed current onset and indicates a distribution of potential inside the body and, thus, imperfect potential control. Result is a distribution of oxide thicknesses, decreasing to the centre of the sintered body. The experiment with sulphuric acid of same conductivity (4.3 mS/cm) proves the dominance of conductivity, the curves are very similar. In experiments with in 1.84 M sulphuric acid (conductivity ?), the shape of the resulting curve is almost identical to the behaviour of planar electrodes, e. g. figure 1.
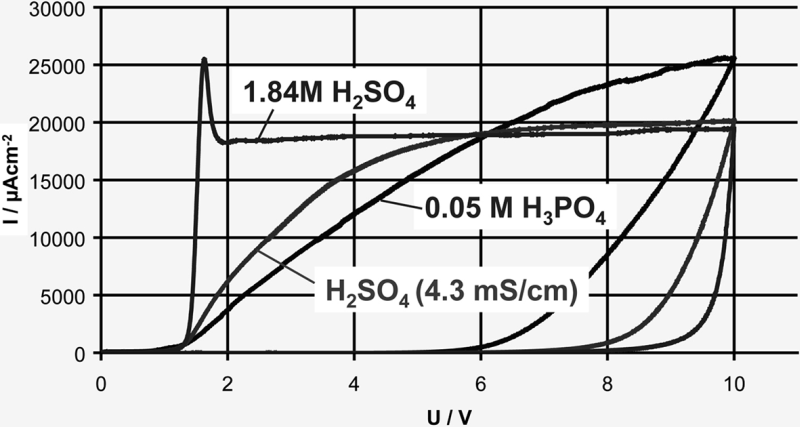
Fig. 10: Cyclovoltammograms of sintered Ta anodes with a surface of 130 cm2 in 1.84 M sulphuric acid, 0.05 M phosphoric acid and sulphuric acid of same conductivity (4.3 mS/cm), sweep rate 100 mV/s
Figure 11 shows a simplified equivalent circuit for oxide covered metal electrodes. Rion represents ionic currents such as oxide growth, Rel electronic currents, e. g. oxygen evolution. Rion is normally extremely high due to the quasi-ceramic properties of the oxide, but is lowered with increasing field strength. Rel is also high in most cases, as oxygen evolution becomes possible only during oxide growth. Both resistances are non-linear, they show no ohmic behaviour but depend on the potential.
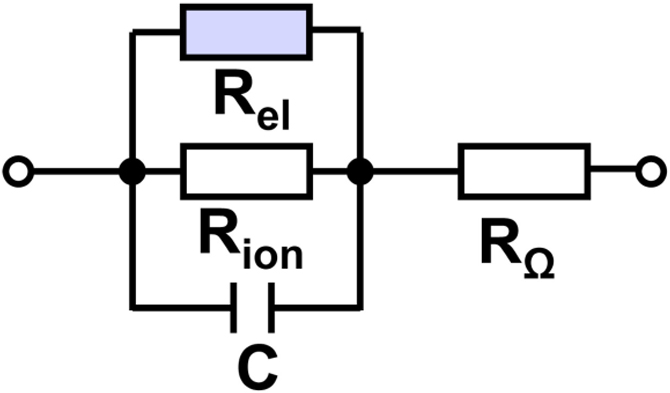
Fig. 11: Equivalent circuit of an oxide covered metal electrode in electrolyte with C interface capacitance Rionresistance of ionic transport Rel resistance of electron transport RΩ electrolyte resistance to reference electrode
Figure 12 shows impedance spectra for two types of Ta anodes. They were anodized to 10 V and measured at a bias voltage of 3 V with sine amplitudes of 10 mV. At high frequencies, the capacitance is short-circuited as the impedance is given by the electrolyte resistance RΩ. The phase angle is close to 0°. The phase angle goes up with decreasing frequency and reaches 90° at about 10 Hz, indicating that the total area of the sintered body is addressed by a sufficiently high electrolyte conductivity of the electrolyte. The slope of the impedance curve is –1 between 10 Hz and 0.1 Hz, again indicating a purely capacitive response in this range. The resistances Rion and Rel are not detected, their influence becomes dominant at much lower frequencies <1 mHz. The capacitance of STA18KT samples is lower and, therefore, shows a higher impedance than STA150KA anodes.
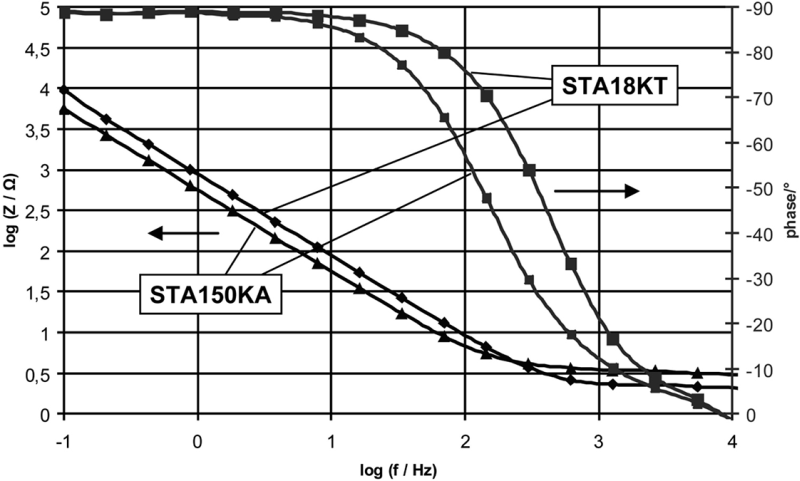
Fig. 12: Impedance data as Bode plots from 100 kHz to 0.1 Hz in 1.84M H2SO4 for two types of Ta anodes, logarithm of frequency vs. logarithm of impedance and phase angle, respectively. Amplitude 10 mV, bias voltage 3 V
A potential of 10 V corresponds to 17.5 nm. The capacitances of 181 µF (STA18KT, 131 cm²) and 283 µF (STA150KA, 232 cm²) yield relative permittivities of 30 and 27 which is close to the common value of 28.
Altogether, the following aspects must be respected to get reliable information from impedance spectra:
- The bias voltage must be at least 1 V below the last polarization potential to prevent further growth, but not to close to 0 V to avoid cathodic effects such as proton incorporation.
- The electrolyte conductivity must be sufficiently high.
- The amplitude of the applied sine wave must be small (e. g. 10 to 100 mV), to avoid non-linear effects of the oxide film or non-harmonic control of the equipment.
- The frequency should be varied in a wide range. Valid capacitance data in figure 12 can be taken at frequencies < 50 Hz.
4.5. Contact areas (so called “sinter necks”)
The contact areas of sintered particles are smaller in diameter than the particles itself. Accordingly, these bottlenecks can be completely oxidized at medium potentials. As a result, the area addressed by electrochemistry is reduced as parts of the anode become disconnected. This is easily observed in cyclovoltammograms up to higher potentials (> 30 V) by a decreasing plateau current.
4.6. Effects of pre-treatment
Figure 5 illustrated why further oxide growth deletes all memory of further treatments. Figure 13 shows the influence of thermal pre-treatment at different temperatures with air contact. The increase of the native oxide film is negligible at 150 °C, but additional 8 nm of oxide were formed at 300 °C. The thermal oxide shows a wide distribution of thicknesses indicated by the slow increase of current at about 6 V. All differences of the three samples vanished after anodization to 9 V.
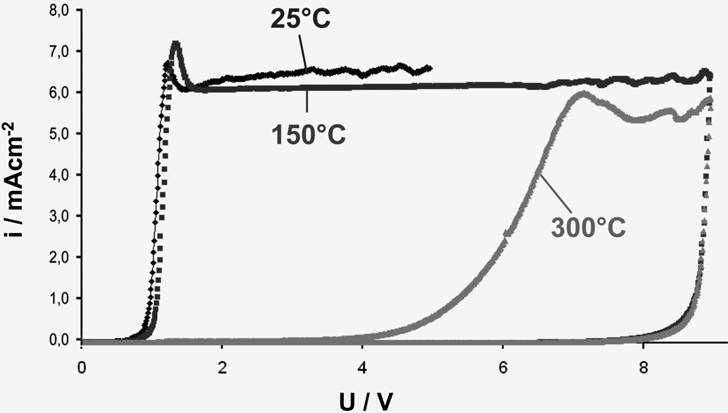
Fig. 13: Cyclovoltammograms after thermal treatment with air contact at 25 °C, 150°C and 300 °C
In industry, however, some samples or even complete charges show much higher leakage currents. This was explained by Freeman [5] as an accelerated growth of oxide at special sites after sintering.
Insulating particles (e. g. oxides of different composition) can hinder normal oxide growth, especially if their diameter is >10 nm. This is shown in figure 14. Such particles blocks parts of the surface, hinder undisturbed oxide growth at these sites or are embedded and weaken the normal anodic film.
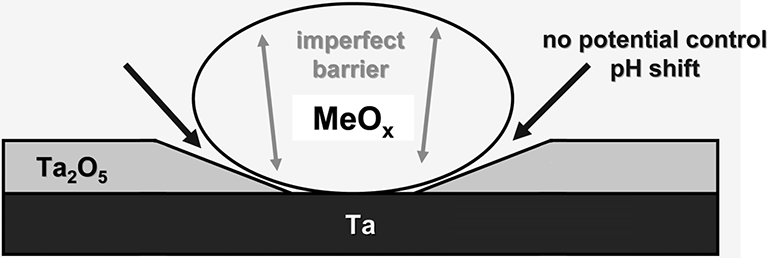
Fig. 14: Oxide particle hinders normal oxide growth (scheme).
5. Conclusions
Tantalum oxide is used to form the dielectric medium in tantalum electrolytic capacitors, as it has a relative large dielectric permittivity. It is easily produced by anodization in aqueous acids and forms thin, homogeneous and non-porous films. Large areas and, thus, high capacitances are realized by use of sponge-like pellets build-up from sintered Ta particles.
Characterization and industrial quality control are easily maintained by electrochemical techniques such as cyclic voltammetry and impedance spectroscopy in a wide range of frequencies to get information about the electrochemically addressable area, the distribution of thicknesses and the dielectric properties. Electrolytes of high conductivity must be used to guarantee potential control within the small pores of the pellets and to avoid artefacts of the complex geometry of the sintered body. The influence of different pre-treatment is lost, if the final polarization potential exceeds all previous ones.
Simulations of anodic oxide growth numeric integration of the high-field law [1] enable prediction of all common electrochemical experiments. Side reaction such as oxygen evolution, corrosion or special effects caused by the special geometry of the sintered body can be identified by comparisons.
References
- O. Kerrec, D. Devillier, H. Groult, M. Chemla, Electrochim. Acta 40 (1995) 719
- D. A. Vermilyea, Acta Met. 2 (1954) 476
- L. Young, Trans. Faraday Soc. 50 (1954) 153
- C. Hammer, B. Walther, H. Karabulut, M. M. Lohrengel, J. Solid State Electrochem. 15 (2011) 1885
- Y. P. Freeman, CARTS-Europe 2006 Proceedings, Bad Homburg, Deutschland
PDF Version of the article |
Flash Version of the article |
|
| [qr-code size=”2″] | ||